Trade the Trend | Episode 29
By Jason McIntosh | Published 25 February 2022
Trade the Trend is a weekly video focusing on where the stock market is going. It’s for investors and traders looking for insights to the market’s next move. Jason uses technical analysis and trend following techniques to help you piece together the world’s biggest puzzle.
Where is the Stock Market Going?
00:00 Intro
00:21 Where is the S&P500 going?
08:22 What a stock market correction could look like
15:44 Where is the ASX 200 going?
19:35 How to handle this part of the market cycle
21:45 Where is gold going?
31:17 Where is uranium going?
Where to invest now?
Looking for ASX stocks to buy now, as well as off the radar ideas most people don’t know? Our algorithms scan the stock market daily for medium term investment trends. We then tell our members precisely when to buy shares. And most importantly, we tell them when to sell.
If you’re ready to get started, try a no obligation FREE 14-day trial of Motion Trader, and see what an algorithmic trading approach could do for you.
Transcript
Please note: Charts available from video
Welcome to this week’s edition of “Trade the Trend,” a weekly video discussing where the stock market is going. I’m Jason McIntosh. It is Friday, the 25th February, 2022. As always, this is a general commentary and doesn’t take your personal situation into account.
All right, with that said, let’s get to our first chart. Well, look, there’s been a lot of developments going on in the market since last week’s video, and so, in a moment, we’re going to look at stocks. We’re going to look at gold and we’ll also have a quick look at uranium.
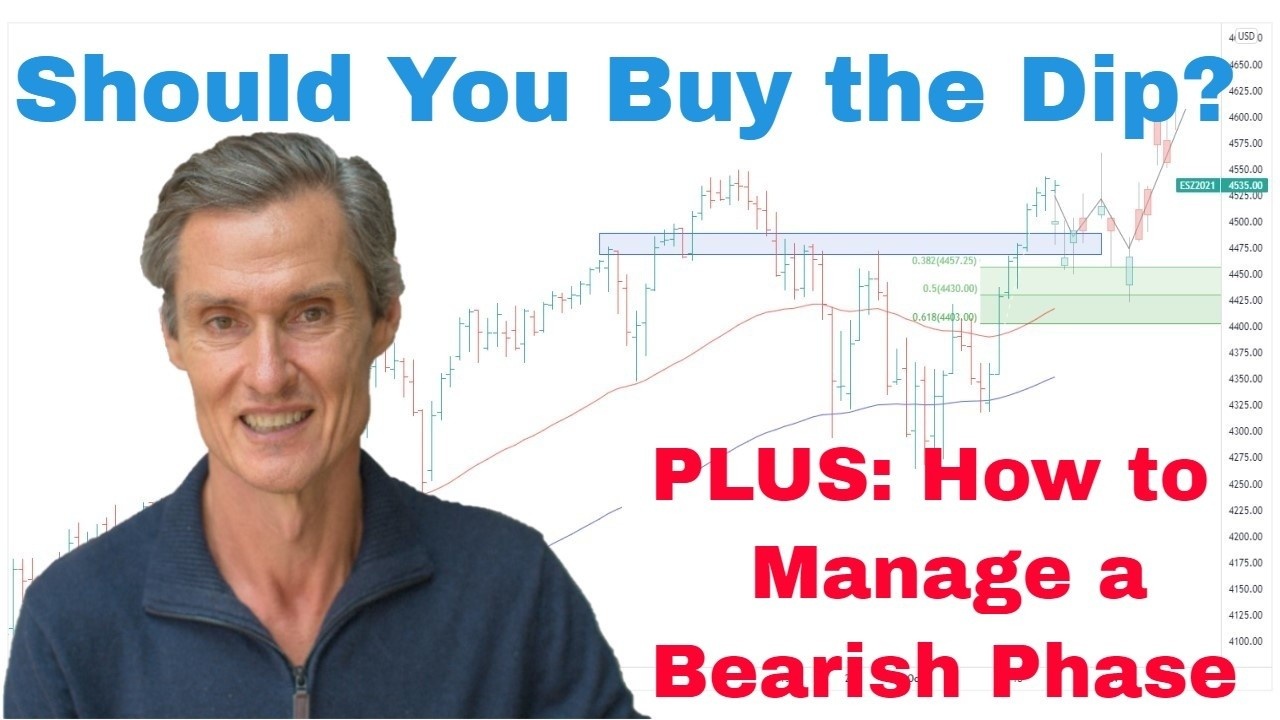
But let’s start off with the S&P 500 because really the stock market has been…Look, there’s been a lot going on in the last few days. So where we spoke last week, we were just sitting here, and my thoughts at the time was that, you know, the market might have one more tilt higher, might test up here, up above these…just above with the…This was a 61.8% fib retracement up here. I thought we may have one more test there or touch above and then have it declined. But as it would have it, we didn’t get that bounce. We just got the decline.
And look, that’s always a risk. It’s always a risk when the market is in a vulnerable position that the bounces are either muted or they don’t happen at all. So, you know, the bounce I thought we were going to get, it was one bounce too much, you know. We got the bounce here and rather than a zigzag type bounce, yeah, the bounce petered out around here and then start to roll over.
And the big development that we’ve had in the week or the big development from, you know, the way I analyze markets is that we’ve got the moving averages. The 50 and 100-day moving averages have crossed and turned to the downside. So, that’s pretty significant. It’s pretty significant when you get those moving averages turning.
Now, what I wanted to do, I just want to go back and look at the last few times we’ve had a cross in the moving averages. So they haven’t crossed to the downside since March 2020. That was, of course, during the COVID crash. And just straight off the bat, I’m not suggesting that this is what we’re looking at this time, but it’s just the last time they cross was at that period.
And we go back a bit further, and the time prior to that was here back in November 2018. And that led to another couple of months of market weakness. And it looks quite significant falls, you know, a month or so after the cross. That’s sort of more the possibility that I’m concerned about now, rather than a crash, more of a correction to come. And if we go back a little bit further still, it’s…and you can see they don’t cross that often. That’s why I say it’s, you know, potentially quite a significant event when they do cross. Time before that was just in this period here.
So, they cross for the first time here during this initial part of a market correction. We got the big rebound, you know, like I’m always talking about looking for rebounds after sharp declines because it’s quite common the way markets behave. And then we got another cross as the market went down for its second leg of the decline. So, look, they’re just a few instances of the 50 and 100-day moving averages crossing.
So go back to where we are now. And look, that’s where we are. We’re only a few days after the cross, so we’re going to see what happens over the next…Look, I think this is the same which could play out over the next few weeks and probably the next few months more, more to the point that this isn’t something which I see working itself out over the next couple of weeks. I think we’re currently into something which could last for potentially a few months.
And as I’ve been saying this, I just do not think this is a time to be buying the dip.
It’s different to when the market was here and people saying, “Oh, look, let’s buy the dip.” Market had then pulled back to its moving averages, and when the market pulls back to a moving average, that actually is quite a good risk-return opportunity to buy the dip because the trend is still upwards. You buy the dip and then you can get the next advance higher all through here.
These are all by the dip opportunities where the market…You got a rising trend and the market pulls back to the moving average. This is different. This is different. This was potentially a buy the dip here, but this dip kept dipping and it broke lower. So that’s where you use risk management. You close some positions. You shut down some risk. Now we’re trading below the moving averages. It’s just a much riskier time to be buying the dip. And there is definitely a vulnerability to the markets when they are below the moving averages.
So, that said, all that said about, you know, the risk of buying the dip here, I just want to go across to the four hourly chart just for a moment just to get a little bit more detail on the most recent price action. And so, just when we look at this, so here we were last week. Here we were last week. We had this sharp fall. Market got to this point about 48 hours ago and we had some…I’ll just use this area through here. I’m going to just…quickly. We had a bit of a support. You can get, you know, a clear support level in there, picks up these lows here.
Market broke this level, and then we got this sharp downdraft. Would have been a case of lots of stop losses being placed below these lows, very logical and an obvious place to put a stop loss and a natural place to put a stop loss. That’s where you put stops below previous lows. And these were lows of significance, and it also, when you look at the daily chart, this band was a big support level we’ve been watching. And so, lots of stop-loss activity.
So you got the sharp move down. What’s been interesting in the last 24 hours is we’ve got the sharp move back up. So, to me, that suggests that maybe we’ve had enough of a clean out of long positions in the market for now at least to have some sort of a near-term low in place. And from there, we’ve got the possibility of getting some sort of, you know, a rebound from this point.
So, look, this isn’t the sort of dip I want to be buying to sort of play this rebound because I’m looking at more from the daily chart perspective about the potential for this market to go quite a bit lower maybe over the weeks ahead. So I’m not looking to play a short-term bounce. But we could see some strength. It’s possible we see some strength develop over the next…look, over the next few days.
And let’s just go back to the daily chart and look what I think could happen. I’m just drawing what I think could happen. Like say we do get a bit of a bounce, you know. It could be a case of…you know. Something like that could develop, and then from there, it’s possible the market loses its momentum, and then we do get another test lower in a month or two months’ time. That’s a sort of pattern I drew out last week, but I was thinking, you know, last week, you know, it was up here.
I was thinking that maybe we get the bounce and then we get the decline, but we got the decline first. So maybe it’s a case of now we got that decline. Maybe now we get some sort of a bounce and then another decline after that. And that would be your classic zigzag correction. But, of course, there’s so much scope for that to be wrong.
There’s so many ways, so many pathways the market could take from here. That’s just to give an idea of the sort of thing which could happen. I think the key here is not whether the market, you know, traces out that pattern or does something else. I think the key here is to really just be very careful with how you approach this market at the present point in time.
So, what I want to look at now, I’m going to go to a weekly chart. Let’s just jump over to weekly, and what I’m going to do, I want to go back to the GFC low and just look at the last…what is it? The last 12 or so years. And I’m going to put it onto a log scale. So you’ll see the chart change shape or touch when I do that. What the log scale does, it just makes the price action at lower levels, it puts into a scale which makes it more readable.
So, I’ll just jump off log for a sec. You see the price action back here gets quite squashed. A bit hard to see. It looks like all the action is happening up here, but percentage-wise, you know, the moves back here were just as significant as the moves up here. So log charts are good for looking at charts when you’re going back 10, 20, 30, even, you know, 30 or more years. The longer back you go, the more useful log charts are.
So, what I want to do here, I just want to look back at a few of the past corrections that we’ve seen over the last 12 years, give some idea of, you know, what could happen this time round. So, we’ll start back here, and I’m only going to look at corrections which were like 15% or greater.
So we’re looking at 15% to say around 35% in depth to the correction. So here’s a zigzag. We got to move down. We’re going to move up and we’re going to move down. And then we move along to here. Again, it’s another zigzag, got the high, have the sell-off, the bounce, the sell-off. Then we get something different the next time we have…So these were both around 20% corrections.
This one here is around 16%. This is more of a flat correction or a sideways type ranging correction. Got the move down, the move up, made a slight near low there. So it is a zigzag-ish correction away, but it is more flat because it hasn’t come down like that. It’s pulled up just below and then rallied. Then we’ve got here. You can see how typical these zigzag corrections are, move down, move up, move down.
That was in 2018. And then, of course, we’ve got the crash. So these are all the various types of corrections you can get, zigzags, flat type corrections, flat or sideways corrections, and crashes. I don’t think we’re getting this one this time around. I think it could be more the zigzag variety but, you know, it could well and truly turn into one of these as well.
So, just to map out how this could be. Look, we’ve already done what could be the bare minimum. You could say we already have a zigzag correction. And the bullish scenario would be that the market did base somewhere around here and then sort of make its way higher over the next…I don’t know. It could be the next month or two. I don’t think so. I don’t think that’s the case because I look at the magnitude of the rally we’ve had from those COVID lows, and that’s like…Look, that’s a big rally which has really gone pretty much unchecked today.
Big rallies need to be checked at some point. So, like, for me, that’s just not enough. I think this market has to do more work over the next few months, so maybe more a case of that we’ve got, you know, maybe the first leg down.
Maybe we get some sort of rebound and maybe that leads to something else in the months ahead. If we put some Fibonaccis on like if we were to correct this whole move and move back down to this region here around that 3,600, 3,800 sort of mark would be within the scope and realms of what we’ve seen in corrections.
And just out of interest to just see, like, what percentage for that is, like that’s a 25% fall into the mid-range of the upper Fibonaccis. Very normal to see a market do that after a big advance over an 18-month period. And, you know, really that’s what all these moves, these corrections were all about.
They corrected larger moves and they did come back within, you know, that…Let’s say averaging around that 20%, 25% mark which is around here. So we don’t know. As I say, lots of scope to call these things the wrong way but I think it’s a live possibility which I think we need to be aware of when positioning our portfolios.
So, look, just to be clear, I’m still along this market. I’m not a bear who’s looking for the worst-case scenario. I’m still along the market because I still have a lot of stocks which are in upward trends, and I’m going to stay with those stocks while the trends are in place and the stocks are above their moving averages. I’ve had stocks hitting their…not their moving averages. I should say they’re trailing stops.
My stock is staying above their trailing stops. I’ve had stocks hitting their trailing stops over the last couple of weeks and I’ve been exiting them as has happened and some I’ve missed and I’ve been able to unload them on the rebounds we’ve had in the market over the last couple of weeks. And that’s why I’m playing it.
So I don’t think this is a case of selling all your stocks or cleaning out a portfolio completely and sitting on the sidelines. I think that’s a dangerous approach because there always is a possibility that this correction does wind up being not as deep as I’m thinking it could be and it does rally again.
So if you’re sitting on the sidelines you will potentially miss that.
If you’re giving your stocks room to move and you can stay with a portion of them, maybe a good portion of them, well, I think it’s better staying in the game than, you know, preempting the worst because the worst doesn’t always happen. And look, as I said last week I think as I’ve been saying for a while, I think it’s a case of people wanting to buy the dip. They’re the ones who need to be extra careful, especially for stocks trading below their moving averages.
And we got to really consider the downside risk when positioning out our portfolios. And I think that’s the way to play this market at the moment. So, I think, you know, we got to expect more volatility. There’s going to be volatility on the upside and the downside. And it’s being careful. Don’t go in there trying to pick the low on this market. It’s a vulnerable market and it’s a risky market.
So, let’s jump over to the ASX 200 and see what’s been going on over there. And I want to start with this one. This one, I’m going to go to the hourly chart just to get us started. And my feeling is that…and pretty much like what I said with the S&P 500, my feeling is this market is going to try and rally over the next…I don’t know. It could be the next day or two. It could be over the next week.
Just looking at this is we have this aggressive sell-off on Thursday. We had all the news of, you know, Russia moving into Ukraine, all war talk, and we had the aggressive sell-off. Interesting to see, you know, the sharp upward move during Thursday session in the U.S. which was in the aftermarket in the ASX 200 on this chart, and markets pulled back but it hasn’t pulled back to these previous lows.
So, it looks like that initial bout of bad news or bearish news is out there, the market is fallen, it’s rallied back and now it hasn’t fallen back to these lows. That suggests to me that the immediate selling is done and there is going to be an attempt to buy the dip. And I don’t think this is a dip that we want to buy at this point but nonetheless, I think there will be an attempt to buy the dip which could push this market higher.
So, let’s skip back to the daily chart, and I’m just going to draw in a couple of possibilities just to sort of show you, you know, sort of things which could happen here. So from where we are here, if we do get a…Look we could get a rally that doesn’t come back too far. It may be just quite a muted bounce, as I spoke about at the beginning of this episode, and then we could have a crackdown where it comes back and tears those lows from a few weeks back and breaks low again and we go into a larger pullback.
And again, you look at the extent of this rally. If we did get a pullback like that, it’s not that bigger deal in this scheme of things if it were to stop around there, like, you know, something like that. That’s only 15%. In the scheme of market movements, that’s not a terribly really big deal. That’s one sort of possibility.
We also could get a larger bounce.
Could see the market sort of come back and break those highs, and actually, I might just do that again. We could see, you know, a larger bounce develop, and then we could be…like it could be some sort of…We could see some sort of like a wedging pattern form. Like these are all things to look out for. They’re possibilities. It’s not predictions.
Like say we got a wedging pattern like that that form over the next few weeks then the market starts to lose momentum and give way and, you know, we get the down move from there for another leg. All sorts of ways this could map out. But the possibilities which I’m favoring which I think are the most likely are the bearish ones at this point.
Less likely for this market, in my opinion, for it to be quickly moving back up to new all-time highs. No doubt in my mind that is going to happen but I don’t think it’s going to happen in the near term. I think this market has, and the developed markets, in general, they’ve got more consolidation, more correction in them before we see higher levels. Maybe later in the year. I don’t know. It’s too far ahead of ourselves at this point to be making that sort of call.
And look, you know, the thing is this part of the market cycle, it’s the least enjoyable for almost, you know, most people. And some people love this part of the market cycle. They like being bearish, but for most people, this is the least enjoyable part, but it’s what we sign up for when we get involved in the stock market. This is part of the cycle. It’s unavoidable. You can’t get out of it unless you don’t play the stock market.
Look, I think it’s the uncertainty which is the hardest part of these parts of the market cycle, and that’s when, you know, the trends are less clear, they’re volatile. Bear market rallies can be deceptive and suck people in and then you got the despair of the down moves. The uncertainty really knocks people around, and that’s why I think a trading plan and having good processes about knowing when to buy and when to sell and how to manage your portfolio, how to spread your risk.
I think that’s why these things are just so important because it’s…Like, the thing is you design your trading plan when conditions are calm and you got plenty of time for clear thinking and then you apply your trading plan, you follow your trading plan, your trading process when all this stuff starts to happen and really gets uncertain. Gets hard and you don’t know what to do. Well, that’s the case for most people. They don’t know what to do. They’re going, you know, “Well, I’ll hold a bit longer. What will I do?”
But if you got that clear trading plan, you know what you’re going to do. You’re going to execute your plan and do what you decided to do, what you planned to do when the markets will come and you could think it out nice and clearly. So, that’s how I’m handling this period. And I think that’s the way to play it over the medium to longer-term to come out ahead to see the corrections off and to come out well over time. Follow your plan and, you know, don’t be too rattled out when these events happen.
And, look, let’s move on from equities. Let’s have a look at something else, something which is going up which has been quite interesting to watch, and that would be gold. So gold has been very interesting over the last…Look, the last 24 hours has been very interesting itself. Got to start with the…I want to look at, like, this price bar here, but to do that, it’s best done on an hourly chart.
Let’s just jump over the bat just for a moment. This was all during the last 24 hours. We had this move and gold went from around 1,900 to around 1,970 thereabouts. And so, look, there’s a $70 move. We had a $70 move very quickly. And I think there’s this, you know, fear of missing out sort of tied up and this, you know, talk of war. There’s tanks, there’s stuff going on, knee-jerk reaction is, there’s shooting you buy gold and you’ve got this quick rapid move up and then it’s all just settled down and you’ve got a quick decline.
Gold is one of those markets I just hate to chase. I don’t like, you know, chasing it. Fear of missing out because quite often, you do get the snapbacks which is very much what’s happened here. So, let’s go back to the daily and try and put together what could be going on here.
Okay. So we’ve had this breakout and the breakouts continued to build on this momentum into that high last night. Put some Fibonaccis on this move to date. And this is what I think could play out over the next, you know, few weeks. We got the moving averages turning high but we’ve got a bit of overshoot here. The gold prices moved quite quickly above the moving averages and we had that sort of like blow-off move overnight.
So, quite possible we’re going to see some sort of also a return move back to this breakout point. So, you know, we could see gold sort of like meander around for a couple of weeks, come back towards the breakout point, come back towards, you know, the midrange of the fibs then maybe it starts to gain some more momentum.
So I don’t think there’s a hurry to rush out and buy gold today. I think in case of right here I think the play is to just wait and see. Wait and see what it does just over these next little bit of time. See if we do get this pullback. See how that develops. See if we do pull back a little bit towards moving averages, let the moving averages catch up to the price.
And if this move is on, if this really is a, you know, legit breakout and the move higher in gold is on, I think this is sort of move which could last for a couple of years, you know, not just a couple of weeks. I don’t think it’s a case of having to charge out there and buy it today.
And let’s just quickly jump to a weekly chart to just…I want to just show you how it shapes up on the weekly. Like, you look at this on a weekly chart. And as I say, like, you know, these moves in gold when they get going, they can last for quite a long time.
So if this moves here is just getting started there could be quite a lot in it and there could be quite a long time that it runs for. Now, I just want to show you a couple of things while we have it. Like it’s possible. So just look at this. We’ve had the big move up and then we’ve had the sideways range. We’re just been in this triangle pattern. We’re breaking out of it now. Similar sort of thing occurred here. We had, you know, big move up, and you can just see it in here. You got the triangle-type consolidation in there.
So just see what happened when gold broke out. Just try to get the scale a little bit better. Yeah. Look, so gold broke out. It had a run and then it had a pullback and then it sort of, you know, chopped around and went sideways for a bit and then it really started to get going.
So, as I say, the first breakout, a lot of people get excited. They charge in. Doesn’t mean it’s going to go, you know, shoot to the moon in the first week. Often, it takes time for the move to develop. That was the case here. That was February, and it didn’t really get exciting until September.
So, really, as I say, if this is a move which could last for a couple of years, it’s probably not all going to happen this week or next week, for that matter. It could take a while for it to do something like this, go sideways, and then round up.
Another possibility which it always got to have an alternate scenario in mind, what could go wrong? What could we be missing? What else could go on to…? Look at this period here. Like, you know, we had the sideways move. It look like we’re getting the breakout, the break higher and it look like the big trend was going to continue then it stalled and we got a big decline. So that’s not my favorite scenario but it’s sort of one which I’m always aware of, like, you know, is this…?
The thing with this is this move has been on the basis of war talk and tanks and shooting. It’s very much news-related. I prefer when a market breaks out no one really knows why it’s breaking out and kind of becomes obvious later. This one has been very much catalyst-driven which the concern with that is it’s sort of like you buy the news and then everything settles down and you get a washout as the people who bought the news get washout as the market does, you know, shakes them out, does something else.
And so, there’s always still that possibility that we get another move down. And that’s where you get your classic zigzags in. You could see there’s a classic zigzag move down, and then from there, we get the big move up. Look, it’s not my favorite scenario. I would go with the break. At the moment, I would go with the break but I’d have that in mind if the break starts to fail and we start to fall back down. I will be going, “Well, maybe that’s what we’re looking at.”
So, it’s just a reason to always be cautious with the market. Don’t think, “Oh, well, this is the time gold is going to double again. I’ve got to get everything in gold stocks. I’ve got to be in everything today. I’ve just got to pay the high. I’ve got to be in because this is off.” It may not be off. There are other possibilities which could happen.
There are other paths gold could take to go a lot higher which don’t involve going up today. Could be going up but could be going up via a trip down here. So you got to be aware of how things could play out. And when I look at these local gold stocks, I’m going to look at…Let’s look at Evolution. And they’re all pretty similar, the Australian gold stocks, and also a lot of the global stocks.
Look at stocks like Newmont and Barrick, they’re a bit different. Their moving averages have turned higher. But then you’ve got other stocks like in some of the other larger North American stocks and also the Australian stocks. These moving averages haven’t crossed yet. Getting pretty close. They are getting close now. So, they could be getting near that time where these stocks are going to start to have a run.
But the thing with moving averages crossing, again, it doesn’t mean it’s like the starting gun and the stock is going to be off and away. When the moving averages first cross, you often get…The market does sort of pullback, do some work around the moving average, and then start to move higher. Doesn’t always. Can just shoot straight up like…look just here.
But this is during the COVID period. It was crazy period. Did shoot straight up. More often, I tend to find does something like that. So I just want to say I don’t think there’s a rush to get out there today and buy all your gold stocks.
That said, my Motion Trader service signaled a couple of smaller stocks this week where the moving averages have turned higher and there is momentum in the share price. So it’s very much a case-by-case basis, but let’s wait and see.
And if you’re interested in this sort of like algorithmic scans that I’m doing to identify these entry points when the moving averages cross and when buying criteria is made, maybe just come across the website and have a look at the two-week trial which I offer for the service. And if you’re just interested to learn more about the process, maybe just come over and go through the four-part training series I have which talks about entries and exits and trading with trends and that sort of thing.
You can find that at my website, motiontrader.com.au. And, by the way, if you’re getting some value from this, please hit that like button and maybe leave a short comment just, “Hey, Jason.” Like the videos or just saying really simple. It just tells YouTube that people are watching. People are engaging with the material. YouTube shows more people and I’ll make more videos. So that would really help if you could please do that. Quick comment and a click of that like button. Okay.
So, let’s just wrap up with one more thing. One more quick thing for the day. A very brief look at uranium because interesting developments through the week and really just in the last night or two really just seeing this move higher. So it’s interesting because we’ve had uranium sitting around this support band for…It’s a while now, this support.
Let’s see, September, really, going sideways for quite a few months now. And when we put the Fibonaccis on, we’ll use this low for the fibs. The market has…you know. It’s come right back to around this 61.8%. We got the support there and now we’re starting to see this move higher. So, look, it’s got to do a bit more work before we get too excited, but it’s a positive development. Better seeing it do that than start to wedge back lower towards this support.
Next thing I’d like to see, I’d like to see, like, you know, break above here. That’d be the next sign that things are going well. Then we look these highs and then we start…you know. If we can get up to around here then we start looking at the possibility that we’ve had a move up, we’ve had a sideways move, and now we’re having another leg higher. So interesting times in uranium. Still too early to say we got a breakout but it’s looking interesting.
So if interesting things happen, well, maybe we talk about that next week. Maybe have a look at a few stocks. Let’s see what happens. Okay.
Let’s call that a wrap for this week. It’s been a volatile time, but look, I think stick to your process and, you know, try not to get emotional about this. You know what you’re going to do, you know where your exits are. If, you know, you’re trading with good processes I think stick to that. I think that’s the best way to manage these, you know, unavoidably unpleasant times. So, thanks for joining in. Thanks for tuning in, and I look forward to coming back. Talk to you next week. Okay. Bye for now.
Meet Jason

I'm Jason McIntosh, the creator of Motion Trader. My career began in 1991 on the trading floor at Bankers Trust. Nowadays, I trade my own systems from home in Sydney.
Motion Trader is for investors who value robust analysis, data driven entry and exit signals, commentary, and education. I use engineered algorithms to identify when to buy and sell ASX stocks. No biases or guesswork, just data driven signals.