Trade the Trend | Episode 28
By Jason McIntosh | Published 18 February 2022
Trade the Trend is a weekly video focusing on where the stock market is going. It’s for investors and traders looking for insights to the market’s next move. Jason uses technical analysis and trend following techniques to help you piece together the world’s biggest puzzle.
Where is the Stock Market Going?
00:00 Intro
00:21 Where is the S&P500 going?
07:22 Where is the Euro Stoxx 50 going?
08:43 Why you should be careful buying the dip
13:07 Where is the ASX 200 going?
14:16 Is this a gold breakout?
Transcript below
Looking for a free stock market training course?
Learn how to identify some of the best stocks to buy now in this free video training. You’ll learn a complete stock trading strategy for buying and selling shares with confidence. We’ll also share real life examples to help you apply the knowledge and build a profitable share portfolio.
Where to invest now?
Looking for ASX stocks to buy now, as well as off the radar ideas most people don’t know? Our algorithms scan the stock market daily for medium term investment trends. We then tell our members precisely when to buy shares. And most importantly, we tell them when to sell.
If you’re ready to get started, try a no obligation 14-day trial of Motion Trader, and see what an algorithmic trading approach could do for you.
Transcript
Please note: Charts available from video
Welcome to this week’s edition of “Trade The Trend,” a weekly video discussing where the stock market is heading. I’m Jason McIntosh, it is Friday the 18th of February, 2022. As always, this general commentary and it doesn’t take your personal situation into account.
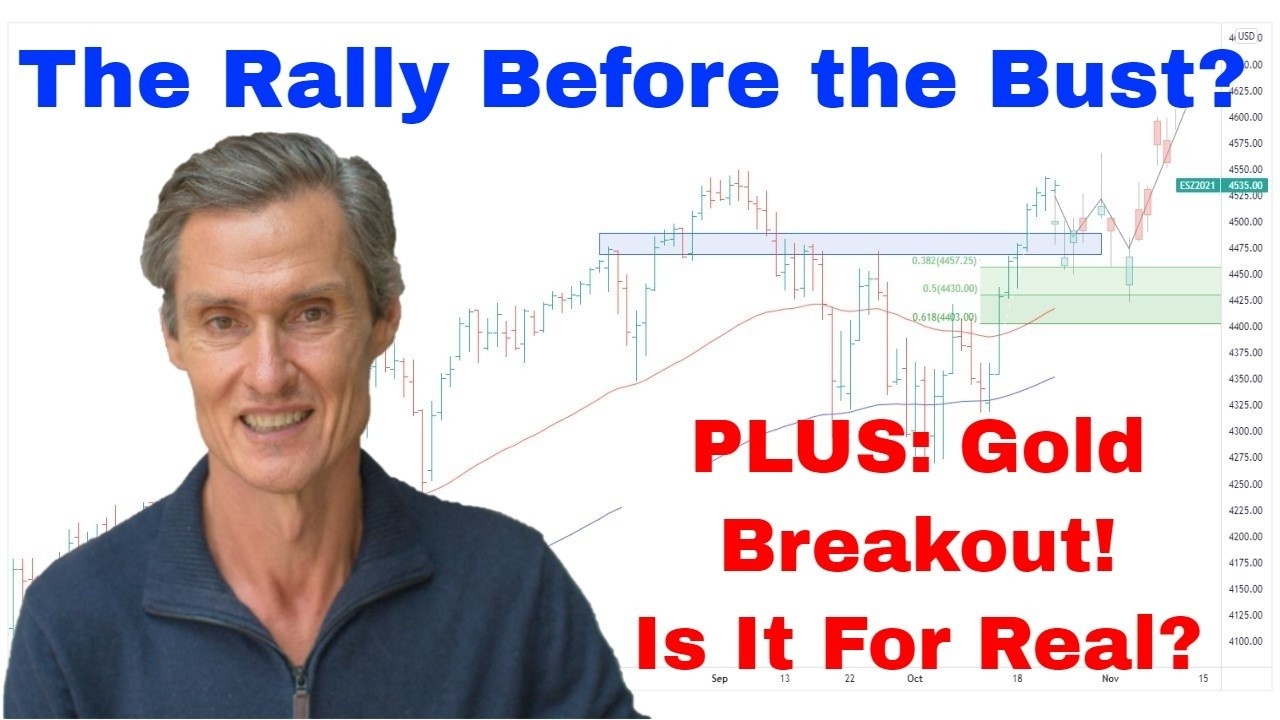
All right, with that said, let’s jump over to the first chart. So, I thought we’d start with the S&P 500 today. And really, look, since we spoke last week, the market has continued to chop around, hasn’t really been any great direction to it. We’ve had a couple of big down days, there’s been good up day in there as well. And this sort of price action is typical of a market which doesn’t have a… Or isn’t really within a dominant trend.
And so let’s just put some…mark this chart up, get some of our levels and things on it. So let’s start by putting in some support. So our support on this is around… Let’s say it’s around about here. Pick up this high, come across. Pick up some of those lows. So, yeah, look, that looks like a support. So we’re getting at the highs here, high here. We’ve got a low, we’ve got another low, and of course, we’ve got the low from a few weeks ago. So there’s our support.
Now let’s put the Fibonaccis on, because they’re always very useful, well, often very useful in these situations of working out where a market might rebound to. So, there’s our Fibs. There’s our Fibs there. So, look, it’s been interesting because the market’s rebounded. It’s got very oversold, rebounded, and twice has tested this 61.8% Fib retracement. So that’s the upper boundary of the Fibonacci zones. And on both occasions, it’s been rejected, market’s fallen. Fallen here, rallied back, fallen back again. Look, what I think may happen here, I think this market might have another tilt at trying to push higher.
And from what I can see, there’s a lot of nervousness in the market at the moment. And I’m seeing reports, there’s been a lot of put buying in the option market. So that’s when you’re putting on insurance for the market falling, you’re buying put options. And there’s also been very high volume going through those inverse or bear market ETFs, both in the local market and in the U.S. markets. And look, the way these markets work, markets don’t make things easy for people. Once everyone’s hedged, and they’re protecting their portfolios, the market often just doesn’t fall on cue, and just come away straight away and make it easy for all those who’ve been hedged. It makes it difficult, and to make it difficult for people who have hedged, that would be for the market to rally.
And that’s why I think we may see some more upside, some more of a rebound in this market. And then that could result in some of the unwinding of these hedge positions, which have been going on in recent times. So, don’t get me wrong on this, I’m not turning bullish on this market, but it just doesn’t seem to me that it’s ready to have a really big test this support and a break of that support. Anything can happen in these markets, we could be talking next week and we’re trading down here at 4,000. I don’t think that’s gonna happen. I’d put my money on the fact that we may well get a bounce before something like that could happen. May not, but could.
So, let’s just jump over to the four-hourly chart, give us a little bit more of a look at how price action looks. And when we look at it like this. So, look, what I’m seeing here, we’ve got this strong rebound off support. That was two, three weeks ago now. This fall so far looks… It looks like it’s quite overlapped, see how it’s overlapping in nature. It’s not like a clean push like that. This is, you know, this is a clean thrust, thrust lower. This is quite overlapped, which suggests to me that the next move could look something like… Well, we could get, probably could get…what I think we could get is sort of this A, B, C zigzag sort of move. Yeah, a bit of a move like that, you know, your classic zigzag correction.
And that may end up looking something a little bit like… This is all…when I draw these, these are just complete speculation. It’s based on things I’ve seen in the past, how I’ve seen setups created. But often, you know, what I think could happen doesn’t happen. They’re just possibilities. So one possibility is that we do see a bit of a run higher, and then the market could start to stall, start to test lower again. And then we sort of like get a bit of a move down then that tests and then maybe breaks this support. So, again, complete… Look, it’s speculation based on corrections I’ve seen in the past, and these things never play out exactly the same way. But you do get these these patterns, these general patterns of zigzag retracements, and then a follow-on move to the downside.
So let’s just go back to the daily, the daily chart. And, yeah, look, so, as I say, I don’t think the market’s set up from where we are now, just to go straight down. I think if the market were to go lower, I think it would probably test higher first, and then look at coming down, that could be a bit away still, that could be a few weeks away, could be a month, could be longer away. So that’s how I’m thinking this could plan out.
I think, for the market to break now it’d really need a big catalyst. If the market were just to drop away quickly, and we got a down move like that, it really needs a big catalyst for that to happen. Whether that be the outbreak of war over in Ukraine, or something that we don’t know yet, something from left field happens and sends it down in a hurry. But without that, I think it’s gonna struggle to break this support at the moment. So, yeah, just look for potential bounce. But, again, don’t get drawn into this as a…that it would be a start of a new bull market, it would need a bit more confirmation than a bounce to start saying, look, the bullish trend is back on track.
And it’s interesting, when I go over and have a look at the…in Europe. So I’ll call up this chart here of the Euro stocks 50. And what I get when I look at this. Look, you can get a big support region, big support region just below the market, you know, somewhere thereabouts. There, I haven’t lined that up precise, but it’s thereabouts. You’ve got a lot of support here. It’s had, just in recent times, just in the last three months, it’s had, what? Three big tests, and each time it’s rallied back up.
So, let me just go over to an hourly chart on this. Just give a little bit more detail. And look, what I see, I see just in the last week, we’ve had the test in that support region, we’ve had this impulsive rally back, and this overlapped corrective-looking pullback. So, to me, it looks like it’s a market that wants to do that. It may well then turn around and find a way to fall in in three, four, five weeks time. But at the moment, it looks…I just find it hard to see how it’s gonna do this, fall away now without a really big catalyst to do so.
So, just going back to the… Just quickly just back to this S&P chart. But look, with all this going on, I think this is really a time for caution. And with all these U.S. indices, so, all of the big ones. You got the Dow, the NASDAQ, the S&P, they’re all sitting below their 50 and 100-day moving averages. And whilst that’s the case, the markets, I think, really do remain vulnerable. I think anyone wanting to buy the dip, I think they need to be really careful about doing that at the moment, especially in stocks that are trading below their 100-day moving averages. So that’d be whether you’re looking at U.S. stocks, or local Australian stocks. If the stock is trading below its 100-day moving average and you wanna buy the dip, I think you really need to consider the risk of doing so.
And I’ll give you an example. We talked about this stock last week, this is a stock from my own portfolio. Well, it’s one which I had in my own portfolio, I’ve since sold it. So this is Lark Distilling. And it’s one my motion trader service picked up, it was back in July last year. And my entry point… So I followed my motion trader service myself, and that’s what I do. So I sent a single ad to members, and I bought this stock myself. I got in somewhere around here. I don’t have my trailing stop on this, this isn’t my trading software, it’s my charting package I use for looking at charts and making these videos for you. But my trailing stop was traveling up underneath, not dissimilar to the 100-day moving average actually. So you could almost imagine this 100-day moving average as my trailing stop.
And what happened in the last couple of weeks, it was just in here, it hit my trailing stop. So my trailing stop gives them like a little bit more room to move than the 100-day moving average. So my stop would have come up and then it started to go sideways here whilst the market was going sideways, giving it room to move in case this consolidation worked its way through and then the market headed up. But it didn’t. It came down, hit my trailing stop, I sold. Last week we were talking about how the market then bounced, and some people would say, “Hey, look, you got that wrong, you should have held on, the market bounced.”
And the point I made last week is, once a stock hits its exit stop and it’s below its moving averages, there’s a vulnerability to that stock. And doesn’t always mean the stock is gonna collapse, but it’s vulnerable to negative surprises. And that’s very much what happened last week. Last week, there was news that the CEO of the company got himself into trouble and the stock was down 10% in a day. It’s been weak ever since. So, anyone who hasn’t, you know, who was holding on, holding on here hoping this stock would go back up, they now got to ask the question, “With it down further, what am I gonna do?” Are you gonna sell it here or are you gonna hope that it goes back up? If it doesn’t go back up and it keeps unwinding, this is a big danger that so many people find themselves in the trap, they find themselves hoping.
So, what if this is how this stock trades over the next 12 months? Now, I’m not saying that’s going to happen, by any means. Maybe it stabilizes and it returns. But the danger is not with the stocks which recover, it’s with the stocks that don’t, and I’ve seen many a stock, many a boom stock going to collapse mode over a 12 to 24-month period, and people who got in at great levels, they give all their gains back. That’s why your exit strategy is so important and particularly so now while we got a vulnerable market. So it’s about, for me it’s about not buying dips on stocks which are below their 100-day moving average. And when stocks in your portfolio get below their moving averages, it’s about having that exit strategy to say, “Okay, got my line in the sand, I’m out. I’m not going to risk this sort of stuff happening.” Because some of your best trades can just end up being disasters. So, it’s time to really be considering your downside risk in your portfolio and individual stocks.
Just briefly jump over to the local ASX 250, sorry, the ASX 200. And look, not really a lot to add on this at the moment. It hasn’t done much in the last week, been a pretty quiet week. It’s still a relatively strong market compared to other markets globally, other big developed markets. But I’m still expecting this market to remain choppy. There’s no strong underlying trend at the moment. This market is in a consolidative corrective mode. So I think we expect more chop over the next few weeks.
And so we’re gonna have a look at gold now. But just before that, if you’re getting value from the video, please hit that like button. Leave a comment, just a short comment, “Hey, Jason, like the video.” Just something simple like that tells YouTube that people are watching, people are engaging, and then YouTube shows other people and I keep making videos. That’s kind of how it all works. So, please do those things, it’d be a great help.
And, yes, the gold. The gold is an interesting one. It’s been the most interesting, I think it’s been the most interesting of the markets this week. So let me just find it here. I’ve got so many markets I follow that it’s easy to… Hear it goes, gold. Easy just like lose one. So, this has been really interesting. Just in here, just in the last last week, gold has broken to an eight-month high, and that’s pretty significant stuff. Because it looks like, potentially, gold is now breaking out of this big range that it’s been in. So let’s draw some lines on this.
So, it’s a bit of a contracting range, a bit of a triangle-type trading range that it’s breaking out from. And there we go here. So this has been in place for, geez, look, that point there is 5th of March. So, almost a year, gold has been stuck within this big range. And we really do now seem to be getting some momentum. Also interesting just here that the moving averages have crossed. They’ve been going pretty much just sideways to low. Crossed here, and now they’re starting to actually like turn up. It looks like the moving averages could be starting to trend higher.
Now, this has been a really frustrating market for a lot of people over the last, look, pretty much since around here. Pretty much around August, 2020, when there was a lot of panic, a lot of uncertainty in the market, there was a lot of talk of central banks printing money. All this stuff was going on, and there was a lot of people positioning, sort of saying, “Hey, this gold market is gonna fly,” and then as soon as all…and we’ve got this parabolic sort of acceleration. And as is so often the case, the parabolic acceleration is heading to what we call a blow-off top. And that’s what happened. The market peaked and it’s been going through this 18-month correction, pretty much.
And so, very frustrating for people, but that’s how markets operate. So we just scroll back a little bit. Let’s look at this. Look at the two years prior to the peak, gold had been in quite a big upward trend. It actually close to doubled in price over a two-year period. So, when you look at it from that perspective, what we’ve seen through here is so stock standard, it’s so not unusual to see a market do this. In fact, it’s what you wanna see a market do. It makes this rise sustainable when you get these sideways and downward corrections and consolidations. It sets the platform or the base for the next move higher. And the bigger the platform, the bigger the potential move higher.
So that’s where we find ourselves with gold now. And we want to see whether this break holds, but at the moment it’s looking pretty good. So, look, we don’t know how it’s gonna perform, maybe it’s going to like, you know, it’ll chop around a little bit above the breakout point and try and rally again. That’d be textbook, that’d be probably the best case scenario. And then that gives you a bit of time to establish positions in potentially some of the gold stocks. But it’s looking really interesting.
And also of interest through the week was Barrick Gold. So Barrick Gold is the second largest gold producer in the world. And I think, is this it here? This is it, this is Barrick. And it just announced, like they had some really good results came out and they announced a $1 billion share buyback. And its price action is quite typical of a lot of the global miners which I look at. So, a lot of them peaked up around this period here, around sort of like mid-2020. They then had a fairly heavy fall down to around March ’21, so about a year ago where that big range we were just looking at in gold formed. And then a lot of them have been moving sideways with this decreasing…moving sideways to low with decreasing momentum. And that is typical of sort of like wedging formation. So this isn’t the most…this isn’t the nicest formed wedge I’ve ever seen, but it does sort of give you the idea of that contracting sort of price action with the momentum, downside momentum is declining or reducing. And now we’ve got this breakout.
So we’ve got a big move up, we’ve got the big corrective consolidation move, and then we’ve got the breakout. And it’s not just Barrick we’re seeing that in now. Just having a quick look at a stock like Newmont. Now, I’ve got some support I drew on a while ago when we spoke about this…look, it was a few few months ago, I was talking about gold stocks and something like Newmont having support round here. Well, actually, it has started to be, you know, it’s been rising over the last few months, creeping higher and the moving averages have crossed and now it’s starting to accelerate upwards.
Looks good. Newmont looks really good on the chart. So you got the two largest gold producers having outward breaks and looking strong. So, you would expect the two heavyweights to be the leaders and then that should filter through to the mid-tier and then the smaller and the more speculative stocks if and when this gold move really starts to take hold.
Looking at the local stocks has been interesting. I’ll use Newcrest as the example. So, what’s interesting with the local stocks is, you can just see here the moving averages, and this is the case with Evolution and North Star as well, the moving averages have not turned higher and crossed yet, so, I don’t have a green light across the sector. It’s looking pretty green for gold, and it’s looking pretty green for those two heavyweights we spoke about. But the local stocks, they don’t have that same momentum yet, although they do all have this wedging formation, which we saw in Barrick. And this is actually a bit of a nicer looking wedge than the Barrick one. Hasn’t broke out of it yet.
So we need to see…look, you can definitely say there’s some support through this area through here, there’s a support band I can just quickly spot by eye. And the market has bounced up. It’s had a couple of tests of it, three tests of it, hasn’t been able to get through it on the downside, which is positive, and now we’ve got this test of the top of this band. So, look, I think this is worth watching closely over the next little bit, whether we get, I don’t know, maybe that’s coming, maybe we’re not too far away from that. So, look, it’s gonna be very interesting. It’s worth watching closely here. I think that if this is the turning goal, I think there’s gonna be time to establish positions, I don’t think there’s a need to rush out and buy all things gold now, like, the moving averages haven’t even turned high yet. The stock can’t rally in this great upward trend without the moving averages crossing. It can have a blip up and then it can pull back, but I really like to see these moving averages cross to give more confirmation that an upward trend actually is underway.
And that’s exactly what I’m doing with my motion trader service. It’s looking for these criteria like moving averages and breakouts, and it’s identifying the points to buy. And it’s not just in those big stocks, it’s also in, you know, those mid-cap and those smaller stocks that a lot of people don’t really know about. So, if that sort of thing interests you, look, definitely come over to the website motiontrader.com.au. You can get a free trial, or not a free trial, sorry, it’s a two-week trial. You can get a two-week trial from the homepage of the website. And I’ll also leave a link in the comment section below this video where you can set up a trial if you want to see sort of the trend identification that we can do using algorithms to scan a whole lot of stocks.
And look, if this does in fact turn out to be the start of a big move in gold, well, look, an uptrend just looking at a stock like Newcrest. Like, looking at over the last seven years, we’ve had that big move up, the big consolidation. Look, I don’t see any reason why a stock like this couldn’t, we couldn’t see this trading up around the $50 sort of mark. You can see a stock like this doubling from here over the next…maybe over the next year or two, if this big trend takes hold. It’s gonna be very interesting to watch.
Hey, so, look, thank you for joining in today. Let’s call that a wrap for this week. Look forward to coming back and talking about the markets again next week. Thanks for tuning in and bye for now.
Meet Jason

I'm Jason McIntosh, the creator of Motion Trader. My career began in 1991 on the trading floor at Bankers Trust. Nowadays, I trade my own systems from home in Sydney.
Motion Trader is for investors who value robust analysis, data driven entry and exit signals, commentary, and education. I use engineered algorithms to identify when to buy and sell ASX stocks. No biases or guesswork, just data driven signals.