Trade the Trend | Episode 27
By Jason McIntosh | Published 11 February 2022
Trade the Trend is a weekly video focusing on where the stock market is going. It’s for investors and traders looking for insights to the market’s next move. Jason uses technical analysis and trend following techniques to help you piece together the world’s biggest puzzle.
Where is the Stock Market Going?
00:00 Intro
00:21 Where is the S&P500 going?
04:27 Where is the Nasdaq going?
08:35 Where is the ASX 200 going?
12:51 Is copper breaking out?
16:49 This is what am I doing with my portfolio
Where to invest now?
Looking for ASX stocks to buy now, as well as off the radar ideas most people don’t know? Our algorithms scan the stock market daily for medium term investment trends. We then tell our members precisely when to buy shares. And most importantly, we tell them when to sell.
If you’re ready to get started, try a no obligation FREE 14-day trial of Motion Trader, and see what an algorithmic trading approach could do for you.
Transcript
Please note: Charts available from video
Welcome to this week’s edition of “Trade the Trend,” a weekly video discussing where the stock market is going. I’m Jason McIntosh. It is Friday, the 11th of February, 2022. As always, this is a general commentary and doesn’t take your personal situation into account.
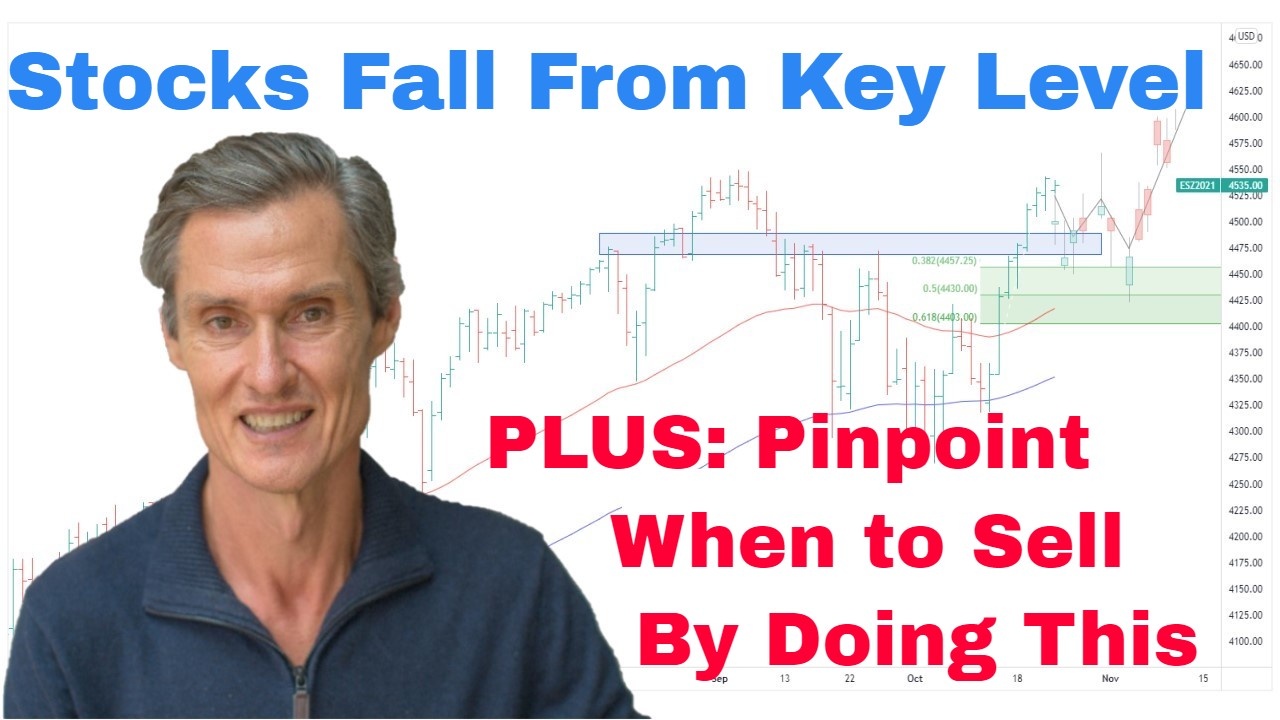
Let’s begin with the S&P 500 this week. And look, I think it’s fair to say it’s been a rather uneventful week in the U.S. Trading has been…look, it’s been pretty directionless really. And we said last week, last week when we were talking, you know, we were sitting round about here, we were talking about how the market could be, you know, choppy, which could be going into a choppy period of price action. And that’s pretty much been the case so far. We’ve had, you know, a couple of big up days and also had a big down day last night. So, it’s very much fitting that choppy, sort of, scenario. And I think it’s a case of we’re still looking for clues as to where this market may be going over the next few months.
So, let’s start by going over to the four-hourly chart because these are always good as you know. You hear me say they’re good for, like, just seeing the internal makeup of what makes up a daily bar on the chart. You just get a little bit more detail. So, what I’ve got here, well, you can see I’ve got this big support band on the S&P around 4,200 to 4,270 thereabouts. And so that’s where the market has bounced off from a couple of weeks ago and got down to that important low. So, let’s put the Fibonaccis on. You know, it’s always fascinating, you know, looking at these Fibonaccis because what we find is that the bounce we’ve had off this low has brought us right back to that 61.8% retracement range. And it’s just fascinating how often you see the markets come back to those Fibonacci levels. And so what we’ve seen, the market has tested this 61.8% twice.
And last night or the overnight session in the U.S., the inflation numbers came out. They had one of the highest inflation numbers in decades came out and the market sold off. So, the market is looking ahead to potential for more interest rates hikes and maybe at a quicker pace, and that’s rattling the market. So, that’s why we’ve seen this sell-off. It’s going to be interesting now to see, like, what happens from here and there. Look, there are all sorts of ways that this could play out. Look, we could say this week could come back further. We could come back and then we could try rallying again. It’s a multiple combination sort of scenario which is on the table. We don’t have a clear-cut trend at the moment where we’re really in that phase where, is the market putting in a topping formation which is going to last for several months or is it going to play out over the next few weeks and base and move higher? We just don’t know at this point in time.
So, let’s go back to that daily chart. Look, I think this is definitely a case of… Look, it’s just one of those times I think we need to be cautious. We’ve got to remain cautious. There’s certainly potential for the market to come back and retest this big support band, which we’re just looking at around that 4,200 level. And there’s also a possibility that we do see the market break lower at some time over the next few weeks, and we start seeing the market come back towards 4,000. It’s just unclear. It’s unclear what’s going to happen, but we do have some levels to watch. We have the upper band of these Fibonaccis to watch over the next week. And we’re going to see whether the market does start to make its way back down towards support. And that’ll give us some more idea as to what to expect over the next several weeks.
So, that said, let’s go to the NASDAQ. And the NASDAQ has…well, look, it has really continued to struggle over the last, last week and it remains relatively weaker than the Dow and the S&P, which have done…look, the Dow has done the best of those three indices. So, the more of the big tech stocks you take out, the better the indicee seems to be going. So, the NASDAQ is a tech-heavy indicee and it’s certainly been the heaviest in terms of its price action. So, you will remember we’ve looked at this. We were looking at this trend channel previously. It’s been in place for 18 months or so. We broke down, we’ve now had a return move close to the breakout point, and now we’re consolidating beneath the trend channel. This is something which often happens when a trend line breaks. You get a break, you get a return move, and then we see what happens from there. It’s quite possible that, you know, the market does continue to come away. But we’re not there yet. So, let’s go to the four-hourlies and look at some more information we can get from that. We can just remove that trend channel for now.
So, let’s look at the… We’ve got the peak from back in December. And let’s do our Fibonaccis down to the low point from the 24th of Jan. So, Fibonaccis, here we go. So, let’s draw these in. And here we go. So, where the S&P 500 has got back to a 61.8%, the NASDAQ has barely made it to its 50%. And the second attempt to rally that we saw during the week has even failed to get back to the previous high whereas the S&P 500 did get back to its respective level. So, it’s a relatively weaker market and it’s certainly vulnerable to seeing some more volatility come in.
And so let’s go back to the daily chart. Now, I want to put our support levels in so we know what we’re potentially looking at. And you can get some supports down around where we do these here. Look, we pick up this high here, bring it through. And we can now just extend this a touch to pick up the low. So, yeah. Look, there’s our support picking up two highs, two significant highs, a significant low. That’s our support level to watch now in the NASDAQ. So, that’s coming in around 13,700 to around 14,000 thereabouts. And the concern I have is, you know, this isn’t over. This has been a nice bounce of head-off support. It’s been what we were expecting. We were expecting like once the market got oversold that it did have to snap back. It has snapped back. It’s done the minimum for the snapback and now it could start to roll over again. That said, it could also have another retest to get back to that 61.8%.
It’s not a market which I’d want to be trading at the moment. I wouldn’t want to be coming in each day going, “Where is the market going to go next?” because there’s not that dominant trend that we had through this big phase through here that we had a really good dominant upward trend. But now with the market sitting below its moving averages and looking heavy, we need to be careful because there is that possibility that we do see the comeback to your support and then maybe we break support. So, I think we should be considering…I think we really do need to consider the downside risk when positioning our portfolios at the moment. And I’ll come back to this in a little bit. I’ll come back to this in a minute. I’ll show you what I’m doing with my own portfolio, how I’m managing this uncertainty around which direction the market is going to take from here.
So, let’s go to the ASX 200, see what’s happening over there because this has actually been one of the strongest markets over the last week. So, while, you know, those U.S. indices have struggled to make headway, over the last week we’ve seen the ASX 200 put on quite a burst. And it’s broken above some resistance, so we’ve been looking at a resistance point around about…it looks something around about here. We can say this was a really big support level. The market held above for several months before it broke. And that should now be resistance, but the market has punched straight back through it. So, look, that’s an encouraging sign for the Aussie market.
It’s interesting to look at what some of the key drivers of the market is, have been. So, like, why is it the local market has done what it’s done? And a big reason for that is iron ore. And if we just go and have a quick look, I just jump away from this chart for a moment, just go to the iron ore market. And here’s a chart for iron ore. So, this helps explain what’s been happening in the Aussie market while it’s been more resistant and more resilient to the current conditions that we’re seeing in the global markets. So, it’s interesting. I actually spoke about this back in early December. It was down here. So, around…I think it was the 10th of December. It was this point here I was talking about on “Trade the Trend.” And I said that I thought that iron ore could be a tailwind for the local market because we’ve come so far. It had been like a really heavy fall. The market was stretched and oversold to the downside.
So, what we did back then, we put on the Fibonaccis because a Fibonacci is always a great way to sort of work out where an overstretched market could retrace to, which is what we’ve done recently with the S&P and the NASDAQ. And I said, “Look, believe it or not, when we’re down here,” I was saying to people, “it might be hard to believe while we’re sitting here, but this market does have the potential to move back towards 140 to 150 being that 38.2% to 50% retracement.” And that’s what we’ve seen and that’s what markets often do. So, when you do get an oversold market, when you do have signs that it has reached, really, a selling climax, you start to look for these big rebound potential. And that’s what we’ve seen in BHP and Rio and Fortescue, which make up a bit over 10% of the ASX 200. That’s why the local markets had a tailwind and…well, not so much a tailwind, but it’s been more of a support or perhaps a safety net or what’s kept it from falling as heavily as those U.S. markets.
So, look, I’m still expecting the ASX 200 to be choppy. It’s holding in well, but, look, we are in a corrective period and I think this market is still going to need more time. I don’t think we’re heading up here. I don’t think we’re heading up to new all-time highs over the next few weeks. Look, I still wouldn’t rule out the potential that this market does dip lower again. It’s holding relatively well, but this is a corrective period. It’s a choppy period. It’s a more uncertain and unpredictable period than when a market is trending. So, caution remains the name of the game.
And now, look, if you’re getting value from the video, as always, if you’re getting value, please hit that like button, and also, please leave a short comment, just, “Hey, Jason, thanks for the video.” Just something that tells YouTube that people are watching, people are engaging, and then YouTube shows other people. And people are watching, I make the videos. So, yeah. That’d be really, really helpful if you could please do those two things. And also, subscribe to the channel if you haven’t already done so. Just click that subscribe button and the bell icon.
All righty. Let’s go to a commodity which has done something interesting this week, copper. Copper. We were talking about copper last week and going through what a potential bearish scenario it could be. And what it’s done this week, well, it’s come to light somewhat. It’s had quite a good up day a couple of days ago, pushed above these highs here, and it’s actually trading up to around a three-month high. So, don’t get ahead of ourselves and say, “Copper has broken out and it’s on its way,” because it does still remain within this…it could still…copper is still very much in this range. It hasn’t broken out of the ranges yet. We’ve had an update, but an update doesn’t create that new trend. But it does…What is interesting about it is because it has broken above this high, so we do have some positive momentum.
So, I think all this does at the moment is that it tells us that I think we need to pay attention in case we do get the real thing, the real breakout. And look, for me, I’m watching this high point here. That’s a significant high. These are sort of like little interim highs, they don’t have the significance as a point like this. And also you can also bound this up by an upper trendline, you know, perhaps as, you know, some sort of a triangle formation developing there, maybe, maybe not, but it does have that sort of shape to it at the moment. So, look, this is a point to watch. That’s around $4.78. This high is around $4.83. So, it’s an interesting one. So, let’s keep an eye on copper. This could just be, you know, a false sort of pop-up and then comes back down within the range. So, it’s just a bit of a flashing light saying, “Hey, look, it may at the moment.” And then we’ll see what happens now. We’re looking to see if it does something more.
Whilst we’re on copper, I’m just going to go to show you this ETF. It’s an ETF listed in the U.S. It’s an ETF made up of global copper miners. This one is interesting as well because also…Look, we’ve got this breakout to an eight-month high, which happened over the last…it happened last night, the break to the eight-month high. So, it’s broken above this high, broken above this high. So, that’s positive. And then we can also…There’s also a bit of a…you’d call this a rounding base, a rounding bottom pattern where the price action has…Let me just pull that a touch. Yeah. Price action, you can see how it sort of comes…it kind of rounds, now starts to round higher. Look, these are potentially bottoming patterns. Look, you’d expect for this to play out. Copper is going to have to come to the party and breakout as well. So, the miner is leading the metal. Which way does it go? We’ve got to wait and see. But it is interesting and it’s worth taking note of.
You can see, look, the market broke above this high, just here and didn’t stay above line. It came back down. So, look, a break to a new high doesn’t necessarily mean that the market is going to charge off into the distance. Often, markets will break to a new high or trigger some stop losses which may have been above the high or below a low in a case of a falling market. And then once those stops are cleared, the market pulls back, which is what happened here. So, you know, maybe the market does stall here, maybe it does come back. But look, if something is happening in copper, we could get a pullback and you get another rally, pullback, and then it really does start to gain some momentum. So, look, just have to see for now how that plays out. But keep an eye on copper. It’s looking interesting.
Now, let me show you what I’m doing with my own portfolio to wrap up today’s trade with the trend. So, I’m going to show you a stock which I sold, which I sold over the last week or so. It’s a stock called Lark Distilling. It came up in the algorithmic scans that I do of the market. It came up, it was over a year ago. It was all the way back. It was back over, back here. It came up in my scans. See, the moving averages had crossed and turned higher, share price had hit a 70-day high. And that’s my trigger. That’s my momentum trigger telling me that there’s some developing momentum within a stock. And I had my stop loss down here, the red line. So, you’ve got to give it a bit of room to move around. And you can see how why that was necessary because it didn’t stay up there immediately. It did come back. It did a bit of work for a couple of months, then started to gain momentum.
So, moving right along. So, what’s happened here is a couple of weeks ago it came back, hit my trailing stop. And so that locked in a gain of 298% I think it was. So, it was a good gain. Really a good gain. It’s been a great trend-following stock. And I think like some people will look at this now, they’ll look at this chart and say, “Hey, you got that wrong. You got that wrong. Look, the stock hit your trailing stop and then rebounded, you should have just kept holding.” And the thing is that you can only say that in hindsight. And we still don’t know what this stock is going to look like in six months’ time. It could be up here to new highs and beyond or it could be down here somewhere. We just don’t know. And this is the thing with markets, you don’t know. That’s why you’ve got to have certainty around when you’re getting out, around your exit points.
So, let’s just say I didn’t sell here. I held on. Say I’m still holding. And say next week the stock takes a bit of a tumble and we’re down at $3.50. What do you do then? So, you say, “Oh, I should have held.” But what do you do if we now quickly get down to $3.50? We get a bounce up to $3.80, then we get another leg down. It comes down to $3. Get a bounce, then we’re down $2.50. What do you do? Do you keep holding? Has it been falling too far to sell and you just got to hold on and hope it goes back up? And this is a problem you get all the time, but particularly when the markets are so uncertain like they are now. I’ve seen people ride a trend like this all the way up, and then I’ve seen them ride it all the way back down to where I got in at around $1. This stock could feasibly come all the way back down. So, maybe it doesn’t, maybe it does. Who knows? That’s not the point. The point is that we don’t know what it’s going to do, so you’ve got to have some certainty around your exit strategy.
And so a trailing stop is how I handle the uncertainty of what the market does next. So, it won’t be perfect in every situation and it doesn’t have to be. And this is the thing. The key is that I’ve got a consistent and a repeatable exit strategy. So, if the market does fall away over the next few months, if those scenarios we’re looking at, if the supports don’t hold and the market does fall away and this ends up being in the…the ASX 200 ends up being a 20% correction instead of a 10%, I’ve got a plan, I’ve got a way out if the market does that. But then again, if the market does stabilize around here and then starts to rally, well, then, because I’ve got a trailing stop in all of my positions and I’ve given them more lots of room to move, I’m still going to be holding a lot of those stocks.
I’ll give you one more example. I’ll show you what I mean. This is another stock in my portfolio. Now, I’ve still got this stock. It’s a company called Kelly Partners Group. A little…well, it’s not so little anymore, but it’s still an obscure stock. I think it’s just outside the All Ordinaries index. It doesn’t quite make the top 500. And so, look, I’m in down here, great trend-following stock. I’ve given it room to move. I’ve stayed in the trend, just stayed in here. So, look, as I said, these trailing stops, they don’t work with laser accuracy, but sometimes they’ll just get you out as it did with Lark, the last example, sometimes it’ll just keep you in. And the thing is being consistent, being consistent with setting them and following them. And what it’s done here is that it’s seen off that latest bout of market volatility, at least so far, and now the stock is heading up and trading at a new all-time high.
And so this is how we manage the uncertainty of the current environment. We don’t know. We don’t know which stocks are going to fall, which stocks are going to fall a long way, which stocks will just pull back slightly and then rebound. So, that’s why the trailing stop, which gives a stock enough room to move so I can see those modest pullbacks. That’s how you can really deal with this situation. We don’t know what the market is going to do, but, you know, you know what you’re going to do, you know where you’re out. So, that’s how I’m handling it. And this has been a great trend. It’s up 450% so far and it’s seen off a few months of market volatility. Who knows what it does next? Maybe this is the last hurrah and it’s about to come back and hit the trailing stop. We don’t know. We didn’t know here. We didn’t know here. And we don’t know here. So, it’s ride that trend for as long as possible, but give your winners room to move.
All right. Look, if you’d like to know more things about that trailing stops, this is what I do at Motion Trader. So, it’s not just about identifying when to buy. I’m also calculating when to sell. So, if you’re interested in all that sort of stuff, come over to the website, motiontrader.com.au. Maybe take a two-week trial. It doesn’t cost much money, only about 9 bucks or something. So, let’s leave it there for this week. Been great that you’ve joined me again. Thanks for tuning in. And I look forward to coming back and helping you put all those pieces back together again next week. Until then, bye for now.
Meet Jason

I'm Jason McIntosh, the creator of Motion Trader. My career began in 1991 on the trading floor at Bankers Trust. Nowadays, I trade my own systems from home in Sydney.
Motion Trader is for investors who value robust analysis, data driven entry and exit signals, commentary, and education. I use engineered algorithms to identify when to buy and sell ASX stocks. No biases or guesswork, just data driven signals.