Trade the Trend | Episode 25
By Jason McIntosh | Published 28 January 2022
Trade the Trend is a weekly video focusing on where the stock market is going. It’s for investors and traders looking for insights to the market’s next move. Jason uses technical analysis and trend following techniques to help you piece together the world’s biggest puzzle.
Where is the Stock Market Going?
00:00 Intro
00:21 Where is the Nasdaq going?
07:39 Where is the S&P 500 going?
11:02 Where is the ASX 200 going?
Looking for a free stock market training course?
Learn how to identify some of the best stocks to buy now in this free video training. You’ll learn a complete stock trading strategy for buying and selling shares with confidence. We’ll also share real life examples to help you apply the knowledge and build a profitable share portfolio.
Where to invest now?
Looking for ASX stocks to buy now, as well as off the radar ideas most people don’t know? Our algorithms scan the stock market daily for medium term investment trends. We then tell our members precisely when to buy shares. And most importantly, we tell them when to sell.
If you’re ready to get started, try a no obligation 14-day trial of Motion Trader, and see what an algorithmic trading approach could do for you.
Transcript
Please note: Charts available from video
Welcome to this week’s edition of “Trade the Trend“, a weekly video discussing where the stock market is heading. I’m Jason McIntosh. It is Friday, the 28th of January, 2022. As always, this is general commentary and doesn’t take your personal situation into account. All right, with that said, let’s get straight over to that first chart.
Well, I think the only place to begin this week has to be the NASDAQ, because that’s really been where all the…you know, bulk of the action’s been. And so, I’ve got the trend channel on here that we’ve been talking about over the last few weeks. Because it’s such a significant item on this chart. And what we’ve seen is that…well, what you have when you see a breakdown from a trend channel, it signals there’s a significant disruption in the previous momentum. So, the momentum I’ve had over here over the last…look, the last year and a half, that momentum has now been severely disrupted as was signalled as we spoke about a few weeks ago as the market looked heavy and started to break through.
And so, let me just highlight some support. Let’s draw some support on this chart to give some idea of where we currently are. So, I’m going to use that low point there. And I’m going to pick up some highs. Let me just do that again. So I’ve got that low point, and pick up these highs. So, the market’s pretty much come right back to this support region that we highlighted last week. So yeah, we’ve got those highs there. We’ve got this significant low here from September, October. And this has been where the market’s been drawn to over the last few weeks. So, if we measure that move to give us an idea of how deep this correction is, if we use a high point from November, and we just bring that down, that brings us to…look, so far, that’s coming in at around 18%. So, you know, you get to 20%, and that’s a technical bear market. So, the NASDAQ really has had a really rough time of it. It’s a significant pull-back, the biggest pull-back we’ve had since that COVID period. It’s the biggest pull-back since…you know, look, you’ve got to come all the way over here to the crash, the COVID crash to get a pull-back of the magnitude we’re currently in.
So look, let’s jump over to…I want to jump over to the four hourly charts just to get some…I want to zoom in on this area here. And it’s going to be best done if we see it on a shorter timeframe than the daily. So, let’s jump over to that four hourly. And now let’s just prepare the chart. So, this is good. And I’m just going to…let’s remove this support zone for now because we know the markets come back to there.
What I want to look at here is…okay, we’re trying to work out, where’s this market going to potentially bottom? Where could it go from here over the next week? What’s really interesting when I look at this chart is I studied a lot of theory called Elliott Wave Theory back early in my career. Elliott Wave Theory’s a really interesting theory. It was devised in the 1930s by a guy called Ralph Elliott. And he proposed that the markets moved in five-wave advances when it was bullish, and five-waves declines when it was bearish. And then after you get your five waves, then you get a move in the opposite direction. So, what we have here…I’m just going to find some Elliott wave markers. Here we go, the five-wave impulse. So, we’ve got wave one here. Wave two there. Wave three. Wave four. Now, I think this market has one more dip lower before it finds at least a temporary low. That would give us our, you know, our wave five down here somewhere.
So, this is all theory. This may not happen. But it looks to me like this is an impulsive decline which means one more tip lower to give us at least a near-term low. And when I look at this, I can almost sort of see…we’ve got a little bit of a wedging pattern forming on the charts here. So, let’s just draw that in. So, you know, we had the market fall heavily during the week. And then we’ve had this just over the last couple of days. It’s been traveling sideways in a volatile but ultimately a fairly flat range considering, you know, the depth of the decline.
So, if this were to go to theory and break lower, we potentially get one more move down. And then from there, you’d look for a significant rebound. So, then you start looking over the next few weeks for something like that to develop. That’s where I think we could be in this selling cycle that we’re currently experiencing. So look, I think we’re potentially close to a near-term low. I’d look for then the strong rebound after there. And from there, what happens if this all pans out, it might not work like this. But if it does, how the market rebounds is going to give us a lot of clues I think to whether there’s another wave of selling after all this. And, you know, we go down for a bigger correction. Or whether this is it, and it’s going to be then a sideways move before potentially going higher. So, I think a lot’s going to come out of the next few weeks to see whether the market does bottom and then does rebound.
And look, just one more thing was from the NASDAQ. Let’s just jump over to…now this, what I’m about to show you here, it’s NASDAQ 100 stocks above their 50-day moving average. So I’ll put this on a weekly chart. So, here we are here. At the moment, it’s very few. It’s only, like, around 12% of stocks that are above their 50-day moving average. So, you expect that in a market sell-off, no great surprise there. But what’s interesting is that, you know, just to give you an idea of how stretched this market really is getting, it’s…you bring this through. And once the market does get into this blue band, it really is just a matter of time before it springs upwards. And you get that reversion to the main type rally where stocks have been stretched so far to the downside that they snap back. And a lot of them will then rebound above their 50-day moving average and pull this graph higher. So, I don’t want to get…you know, I think we’ve got to be careful about not getting too bearish just at this point. There could be a bigger bearish story playing out later on. But I think for the moment, we could be getting to the point where, you know, it just can’t go much further, because that rubber band is now getting so stretched that it does need to rebound to the upside. So look, a few interesting points to think about there with the NASDAQ.
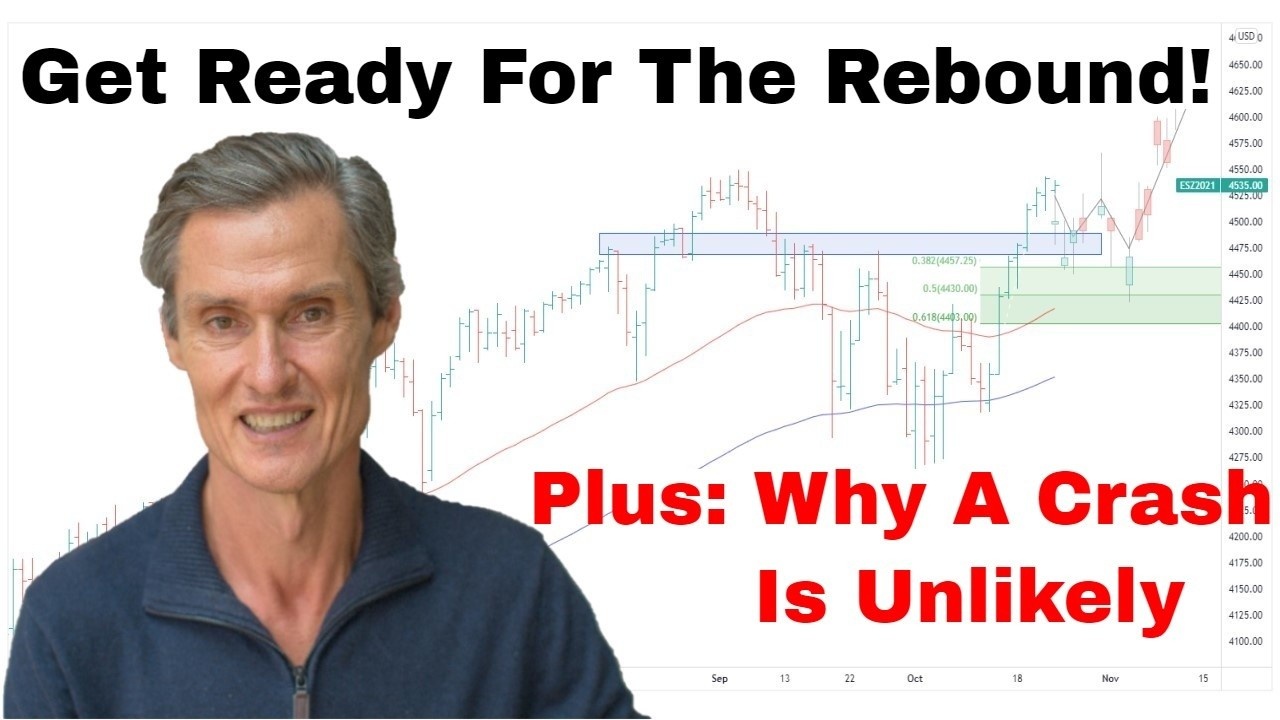
And when we go to the S&P 500, it is…I’ll use this one. It’s a very similar story. So, here’s the chart from last week. I’ve left the support that we drew last week. Actually, let me just go back to the daily chart. Here we go to the daily chart, yeah. So look, there’s the support region we drew in last week. And we talked about the market having the potential to come back to this October low through here, and that’s very much what it’s done. It’s sitting on that support. The potential is there that it does test this support again. It could edge through it. But I think we’re getting close to that point where we’re going to get a decent rebound. So to be clear, I’m not suggesting a new bull market, but merely a rebound that helps the market just correct itself from that oversold situation which is where it currently finds itself just because it’s fallen so quickly. And so we need to get that reaction on the other side to balance that out.
One of the possibilities which I think…you know, look, it’s not a base case, but it’s just a possibility that we see something like 2018 start to happen. It’s this sort of period through here which is interesting to look at. It’s just interesting to at least get an idea of, like, how markets can move. So, this was interesting because we had the, you know, the sharp initial sell-off. And then we had…look, it depends on whether you want to look at it from here or here. But either way, you know, we got a decent rebound which continued on for a few weeks. And then we got another decline. These things never play out the same way. But you do get zigzag corrections. So, that’s one of the possibilities here. Are we going to see a zigzag correction? Which would be…so, a zigzag correction would be…you know, we got our first move down maybe somewhere around here. You get the rebound. Like, the rebound could come to here. It could come to here, no idea particularly at this point. And then you get another leg down. So, that’s a possibility that could start to become clearer over the next few weeks, completely speculative at the moment. But just looking like how corrections can unfold. Then you get ones like this, initial leg down, the rebound, and the test low turns into a sideways range. It doesn’t actually break the low. So, all sorts of things that could happen.
The market rallying to a new high, you know, in the next few months is also possible. We don’t know. That’s why I say we need to see this rebound if that is what’s going to happen. And see what happens…what starts to develop from there. All right, now. And of course, look, if you’re getting some value from this video, please hit that “Like” button. Leave a short comment. Just like the video. It just tells YouTube that people are watching and engaging. Then YouTube show other people, and it just helps me build my YouTube channel. I keep making the videos. So, that would be really good if you could do the “Like.” And just a really brief comment would be fantastic.
And so now, let’s go over to the ASX 200. Go over to the local market. And this is an interesting situation. So, what’s happened here is the market has come back to support. So, I’m going to draw in the support region we drew in last week. So, it was something around here. So what we had…we picked up a high here, a high region through here. Yeah, through here. It did some work within the range. Just broadening a touch just to there. Yeah, you know, picked up this low point from September. So that was a bit of a support range. And we talked about, you know, the market coming back to there.
Actually, I think we actually tightened it up. I think we actually worked off a support range through here. Actually, that’s a better fit. Pick up this high. Pick up these lows. So, this is the thing with support range is you can…there’s all sorts of ways to do it. But look, let’s work…this is the range from last week, this narrow band. So yeah, it picks up all this, and picked up the low. So, what we have there is kind of what we were looking for. And it’s also interesting that it’s also in the Fibonacci band. So let’s put on some Fibonaccis. I’m going to use this as the low point. I think that this was a completed move. Then we had a consolidation. And now potentially, this is a completed move. And now we’re having the consolidation or the correction. And look, it’s just interesting to see the market come back between that 38.2% and 50%. Maybe this is going to be a bigger consolidation like we’re talking about with the S&P and the NASDAQ, but we don’t know this year. At the moment, let’s just work off what we have. The market’s fallen to support. It’s within that Fibonacci band. So to me, it gives the impression that, yeah, we could be getting close to at least a near-term low.
Now what I want to do, I want to jump over to the four hourly charts, again, just to get some more detail of this section through here. So, jumping to the four hourlys, let’s take that support out. We don’t need that just here. Now, again, it’s interesting. We talked about the five waves of the Elliott decline, or over an Elliott impulse wave. And you can get the same thing going here in the ASX 200. So what we have, it’s like…the thing with the Elliott wave, I stopped using Elliott wave because I found it difficult from a consistency point of view. But there are times where it does start to look quite clear. So look, pretend you’ve got a wave one, a wave two, a wave three, four, and five. So, you can potentially count a five-wave decline there. Now, it’s possible that’s not it. And it does test a bit lower again. But I think it’s getting rather close. So, you know, again, it’s that case of, look, if the U.S. market goes down, you expect the local market to have another test low? I say, yeah, it could test lower, but then we’re getting close to what I think we could say is that rebound. So, you know, this is interesting from the perspective if you’re holding stocks which you think you should have sold a little bit earlier, and you’re wondering what to do, well, this is one of those points where you could say, “Look, I want to sell into the rebound,” if that’s what happens. So, that’s a possibility. That’s very much what I’m thinking about as a potential over the next few weeks.
So let me just go back quickly to the daily chart. And what I think is interesting to look at just to get some perspective around this because I think a lot of people are worrying about a crash. Hear people talking about, “Look, the market’s going to crash again.” Now it’s interesting, there’s the pre-COVID high. The market’s already below there. So, it’s actually quite a different setup to the U.S. markets which is quite a bit above. I think the U.S. market has more potential for downside volatility than the local market. So, I don’t think we’re going to see another COVID-style crash. I think it’s unlikely. In fact, I think it’s highly unlikely. Anything’s possible, but I just don’t think that’s going to happen again. Look, things don’t unfold the same way as they did in the recent past. It typically doesn’t work like that.
And what’s interesting with here is the COVID crash was just so hard because it just went straight down. You didn’t get that rebound which I think we might see now. So, the COVID crash was down and it was interesting. When the market was here, I had some exit stops which I missed, and just because things moving quickly. I was busy. I was caught up and I missed some stops. It happens. And I thought, “Well, this is okay. No need to panic. Because the market will probably rebound as it almost always does, get a rebound, and then we can assess. And if it goes lower from there, you know, we can react to that.” But during the rebound would be the time to unload some stocks I was holding. But it didn’t happen. As we know, it just went straight down. Such a unique situation. I don’t think that’s going to happen here. That’s why I’m very much on the lookout for, you know, do we have a temporary low? And do we get…are we close to getting that rebound? And then from there, we’re going to have look at that and carefully assess, like, how is it rebounding? And then that will give us some clues to, like, how the next few months may well play out.
So, very interesting times. Look, it’s been a rocky week. Hopefully, next week’s going to be a little bit more positive. We’ll have to wait and see. So look, let’s leave it there for this week. Thank you for joining in. I hope that helps put some perspective to the week. And let’s come back, and try and put all those pieces together again next week. Thanks for joining in.
Meet Jason

I'm Jason McIntosh, the creator of Motion Trader. My career began in 1991 on the trading floor at Bankers Trust. Nowadays, I trade my own systems from home in Sydney.
Motion Trader is for investors who value robust analysis, data driven entry and exit signals, commentary, and education. I use engineered algorithms to identify when to buy and sell ASX stocks. No biases or guesswork, just data driven signals.