Trade the Trend | Episode 24
By Jason McIntosh | Published 21 January 2022
Trade the Trend is a weekly video focusing on where the stock market is going. It’s for investors and traders looking for insights to the market’s next move. Jason uses technical analysis and trend following techniques to help you piece together the world’s biggest puzzle.
Where is the Stock Market Going?
00:00 Intro
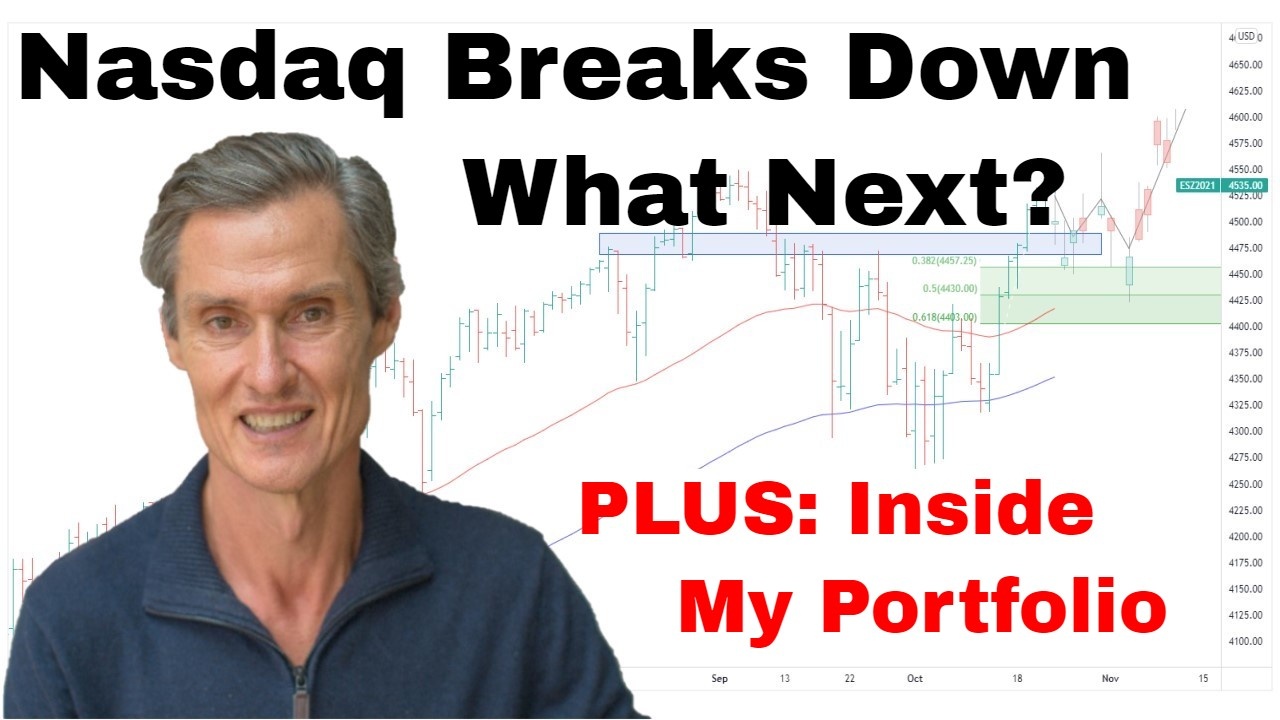
00:21 Where is the Nasdaq going?
06:11 Where is the S&P 500 going?
10:05 Where is the Russell 2000 going?
12:39 Where is the ASX 200 going?
20:40 What an I doing in my portfolio?
Looking for a free stock market training course?
Learn how to identify some of the best stocks to buy now in this free video training. You’ll learn a complete stock trading strategy for buying and selling shares with confidence. We’ll also share real life examples to help you apply the knowledge and build a profitable share portfolio.
Where to invest now?
Looking for ASX stocks to buy now, as well as off the radar ideas most people don’t know? Our algorithms scan the stock market daily for medium term investment trends. We then tell our members precisely when to buy shares. And most importantly, we tell them when to sell.
If you’re ready to get started, try a no obligation 14-day trial of Motion Trader, and see what an algorithmic trading approach could do for you.
Transcript
Please note: Charts available from video
Welcome to this week’s edition of “Trade the Trend”, a weekly video discussing where the stock market is heading. I’m Jason McIntosh. It is Friday the 21st of January, 2022. As always, this is general commentary and doesn’t take your personal situation into account.
Well, with all that said, let’s jump over to our first chart. And I thought we’d kick off with the Nasdaq today because really that’s really been where I think the most important action’s been happening in the past week. And we looked at this chart last week, and last week, we were talking about a trend channel which is on the chart. Really clearly defined trend channel which I’m just going to draw in place now so we’ve got that reference in front of us. So just line up the highs and the lows, get a nice, tight fit. And we can just drag that a touch more. So, look, that looks…yeah, that looks pretty good for today’s purposes. So that’s our trend channel.
This channel had been in place for about a year and a half. Dates back to…oh, what’s this back here? Back at September 2020. So really, really important trend channel, I think. And it’s also very well defined. You remember last week I was talking about all these touchpoints, all the times the price action’s come back, touched the support from the trend channel, and then bounced. Even just here, it overshot a touch but got a bounce before breaking. And the more times the price action touches a trend line, the more significant it becomes. So, this one here, we could say that is one, two, three, four, five, possibly six touches. Say four to six depending on how you want to count them where the market’s touched and then rebounded.
And last week, we were saying that…well, look, I was saying last week, last week we were sitting right around here. I was saying, “Look, this market’s feeling heavy. Feels heavy. It feels like it wants to break through the support from this trend channel.” And, well, that’s, you know, that’s pretty much what we’ve seen over the last few days. So, what have we got here? We’ve got a trend channel which is broken and we’ve got a market which has traded down to new lows. Another significant factor is this line here. This is the 200-day moving average. And we’ve now broken below the 200-day moving average. And that’s significant in itself because this is the first time since April 2020. So, you’ve got to go back to here.
So, first time since April 2020 that the Nasdaq’s price…this is the Nasdaq 100. That the Nasdaq 100 has been below the 200-day moving average. And an interesting statistic that I saw earlier today, this was actually the third longest run in history where the Nasdaq’s been above the 200-day moving average. You know, third longest run in history. And I thought the other two might’ve dated back to the dot.com days back in the late 1990s. Actually, turns out the two longest were only in recent years. So that’s the power and the strength of this big run we’ve had in technology over the last, look, maybe…look, since the lows from the JFC. It’s all packed in that period there. Even since then.
So, it’s been…yeah, look, really interesting stuff going on. And so, there’s definitely some heightened…there’s definitely is. There’s definitely heightened risk in this market and the next level I think to look at, next level to look at is going to be these September lows at around 14,400. And we can draw some support. Look, you could probably say…look, picking up these highs, the high here and the high here, if we pick up those highs and draw some support, pick up that low from October. And so, this is a support band, around 13,800 to 14,300. We’ve got a big band of support for the Nasdaq. And, you know, if the market does get down to there…and so yeah. We don’t know this for sure by any means but that’s something like a 15% correction. So, anything over 10% is called a correction. So, we’re definitely getting to that correction territory.
At the moment…look, where are we at the moment? At the moment it’s…look, we’re just crossing into the official, you know, bounce of a correction now for the Nasdaq. So, look, I think this is, you know, a very realistic area that we could be looking for this market to get down to. And I think, like, look, with a trend channel…we’ve got this break from the trend channel so you might say, “Well, look, what does that actually mean? What’s it mean when a market breaks out of a trend channel?” Unlike things like some of those chart patterns we look for like, you know, those rectangular congestion zones or a flagging pattern or a triangle, something like that, there’s no real measured move out of a break from a trend channel. But what it does show, it shows that there’s a significant disruption to the prevailing momentum. So, this momentum, strong momentum we’ve had over 18 months or so, we’ve now got a real disruption to that momentum. And to me, I think this looks like we’re heading into a longer period of consolidation. I don’t think we’re heading for a crash or something dire but I think we’re heading…I think it’s going to take time. It’s going to take time for this market to do some backing and filling. And it’s probably going to test lower levels. That’s my thinking.
So, it’s interesting. The S&P and the Dow actually look relatively better than the Nasdaq but I think you had to expect that this weakness from the Nasdaq is going to…and if that continues to occur, that that’s going to flow through to the other indices.
So, look, let’s jump over and have a look at the S&P 500. So, as I was saying, this is a relatively stronger chart. You can see it’s still holding above its 200-day moving average. But I think it’s a… look, if I was just looking at this chart on its own, I might be thinking, “Look, this is still within the realms of being just a consolidation of this move. It’s still within the realms of being a consolidation of that.” Looking at the Nasdaq when I pair them up and I look at some of the other stuff we’ll look at today, I think it suggests we’re looking at something more than just a correction of this move. And it’s, I think, this…look, I think the S&P, it is vulnerable. It’s vulnerable to more downside and that’s largely because it’s just so much big tick which is inside the Nasdaq 500.
Now, often I like to do the Fibonacci levels. It’s actually a little bit of a tricky point for doing the fibs on this chart because we don’t know what degree of decline we’re currently seeing. So often you’d see me do the fibs, the Fibonaccis on, like, a move like this. I’d look at the recent low, go up to the high of that run and you’d say, “Look, we’re around the 61.8.” Nasdaq’s quite a bit below there. So, look, I’m not looking at this fib to hold. I think it’s a bigger degree move. So, then it’s okay. If we’re not looking at that…and just to give you an idea of, like, how we use fibs on these smaller moves, like, you’d look at, like, you know…we’d look at, like, there to there and you…so, you know, came back into the fib zone. And then you look at something like, you know, here to here, came in the fib zone. So, looking at these short advances and pullbacks, the fibs can be really good for identifying, you know, by the dip type strategies if you want to play the, you know, the buy the dip in a rising market.
So, let’s just get rid of those. So, it’s like where are we? What degree are we looking at? Are we correcting this whole move from here to the peak? In which case you go up…retracement level’s quite a bit low. You know, a lot lower than where we currently are. But maybe that’s not what we’re doing. Maybe, like, the next point I’d look at doing a fib from would be from here. This was the last 10% correction. So, you could say that this has been one long run since then. So, we’re going to do our fibs off of that point.
You know, we get potential levels down to around, you know, 4,200. And it’s interesting to put some support on this chart because when you do that…so say we’d pick up…we’d probably look to pick up the high, the high there. The low so…yeah, maybe around there. I wonder where they would come and touch, touch lower. Yeah, it’s probably…look, you’d probably look to pick up a support region through there which just happens to be above the 38.2% of this run, of this run up to here.
So, look, I think there’s some definite vulnerability in this market and in the S&P. I think we’ve got to start looking at the prospect of coming back to test this support. You know, maybe this is the fib zone. It’s a bit hard to say at this moment. But, you know, we’ll just keep watching this and see how it continues to develop. But again, I think weakness is the expectation at this point. Quickly across to the Russell. And so, the Russell is the U.S. small cap index, got 2,000 small caps. Big small caps, say, range from about $100 million to about $2 billion in size but they make up the…you say they make up the rank and file of the U.S. economy. And so, the big pattern over the last…oh, look, over much of the last year has been this rectangular trading range which the market found itself in. And we got that breakup back in November. It started to look really encouraging. And maybe this was a sign that that big middle America economy was going to be performing really well. But it was a short-lived break. It’s what we call a false break and we knew pretty quickly that that possibility of a strong run in the small caps was off the table.
Back into the range. A few weeks ago, we were talking about support down through here at the bottom of the range and we thought, “Look, maybe we’re going to get a bounce.” We did get that bounce but now it’s starting to roll over again and it’s broken to the downside. So, look, what do you do from…where does this go from here? We can do a measured move of the range and then we can…once we get that, we can then just project that down. So that gives possible targets for the Russell. Look, the targets are quite a bit below the market. This is why I think we’ve just got to be really cautious as what we’re doing with our portfolios, the stocks we’re holding, how much we’re giving them the mood because there are scenarios on the table now that do put this market coming quite a bit lower over the next…maybe the next few weeks, next couple of months. There is this definite vulnerability. If we do the Fibonacci…we can do a Fibonacci on this whole move and interestingly enough, you know, it encompasses this potential theoretical target from, you know, the width of the range bringing it back just below the 38.2% and above the 50%.
So, look, there’s some stuff going on we’ve got to be careful with. And yeah. I think the immediate possibilities are very much…the base case is now swing into reconsolidation. It’s like how deep is this consolidation going to be? How long is it going to take? So, caution is the name of the day.
Let’s jump over to the ASX 200. And because it’s been performing relatively better than the U.S. market. It’s also interesting that the European markets are performing a lot better as well. So, the U.S. has been the point of our performance over the last 18 months. So maybe if we do get this downside move, maybe the bulk of the losses are in the U.S. markets or that elsewhere in the world at least outperforms. It underperformed on the upsides. So maybe it’s going to now outperform on the…during a consolidation. So, we have to wait and see.
So, look, the pattern we’ve been looking at in recent times has been this triangle trading range. You know, it had so much potential to it but it’s a… yeah, look, it’s disappointing. It didn’t follow through. We got the break and we got a rally but it fell short of its potential which was, you know, up above…up towards 8,000. And last week we were saying…we said, “Look, if it breaks below these lows,” like last week, I think we must have been about here, we said, “Look, if it breaks below these lows, it invalidates the pattern.” Well, the pattern was invalidated a few days ago. The triangle really is no longer a pattern to take any notice of. We’re back within the range. We’re back within this broad range the market has been in since around August.
And so, look, I want to…let’s duck over and let’s duck over and have a look at the four hourly chart because it’s always interesting to sort of look at the…just how the internal makeup of the market is. So, the daily’s good but then you see sort of, like, what makes up a daily bar by looking at the intraday bars. So, four hourly gives you…it’s a good mix. Not getting too fine a detail but it’s giving you a little bit more.
So, what we’ve had? So, we’ve had this initial sharp move down. Look, that was a pretty impulsive move down. So, it had to have force to it. Then we’ve had this sideways consolidation. It’s like, you know, looking at it in hindsight now, you can start to say, “Well, look, yeah. Look, you can see. You can see how the impulse was down. The move sideways was quite weak and consolidative and now we’re starting to, like, get the more impulsive moves to the downside again.”
So, you know, you’ve got the move down, the consolidation, the move down, the consolidation, the move down again. So that’s picking up steam to the downside. So again, it shows you there’s that possibility that we are going to see, you know, continued selling. So, what I think we could see…look, maybe we get a bit more selling down to these lows, the lows from September, October, and December. Could get some sort of a bounce off there. So not dissimilar sort of moves we saw, like, a couple of weeks ago where you had the strong move down, you get the sideways and then you get a break from there. So, look, I’ve got to say that looks now like quite a plausible scenario for the ASX 200 that we do get that downside break.
So, let’s jump back to the daily chart. Just have a think about, like, how this could work out. And look, so let’s draw some support. Let’s start by looking at some support possibilities. And I think we’d look at…we’ll pick this high here. We can run through then. That picks up a couple of low points. And does it come across a bit more? Yeah, look, it picks up another bit of a high here. So, it picks up a high, some highs in there, some highs in there. Picks up a couple of lows. This is a good possible support line for the market to come back to. And it’s interesting. Let’s just draw some fibs, Fibonaccis just out of interest. I’m going to use this point here because let’s say that’s a significant move on a sign, then we had a significant consolidation. Now we’ve got another significant move. And this is a… looks like the next big consolidation. So, if we measure this move to get some fibs…so again, it’s interesting. It potentially looks like…so this support is within that fib band. So, look, it’s possible we are on the verge of seeing the ASX 200 start to move below 7,000.
So, if we…let’s just get some measurements. So, at the moment, the market is off… Look, the local market’s only off something like 6% all up at the moment from the high. So, at the moment, it’s not a big deal. Question is, how much is this going to extend? So, if this sort of scenario we’ve been talking about does play out and we do get back to this support, that gets us down to around 10%. In a scale of it all, if the market came back 10%, it would be well within the bounce of a healthy…look, it’s not quite every day but every 12 months or so sort of correction. You expect these 10% moves and the market needs those 10% moves to keep a healthy market. So maybe that’s what we’re looking at playing out now.
And look, and I’ll tell you…look, I’m still long this market. I’m going to continue to do so, you know, notwithstanding these…you know, looking like there’s a good prospect that we are going to pull back. I’m still long. I’m not jumping out and going short. I haven’t done any hedging on this move down because the local market just hasn’t looked as vulnerable as the U.S. market is looking. I’m going to look at the stocks within my portfolio and make decisions based on that as well. So look, I’m still long and I’ll do so while those trailing stops are intact. And, you know, it’s interesting to see. My Motion Trader subscription service is still finding…has still been identifying buy signals in the…across the ASX and over the last week. Interesting thing is that a lot of those are commodity plays. So, there’s still upward momentum in the market but it’s very much stock and sector-specific. And if the market does start to pull back, believe in those commodity plays, I’d expect to at least pause but maybe they don’t pull back by as much.
So, look, not everything has the…on the same profile as the Nasdaq. So, I think we want to avoid jumping from…well, I think we want to avoid jumping to expecting the worst because, you know, the worst may not play out here. So, as I keep saying, it’s caution but it’s not, “Okay, this is…there’s going to be another crash.” Because we don’t have enough information lining up to suggest that’s the scenario.
So, look, if you’re getting some value from this, please hit the like button. Leave me a short comment even if it’s just, “Hey, liked the video.” That tells YouTube that people are watching it, people like it. Then YouTube keeps showing people and when people are watching, I make things. So that’s, you know, that’s all a good thing. And maybe even hit that subscribe button if you haven’t already. So that also just helps me build my YouTube channel. So that would be really good if you could please do that.
And so let me just…I just want to show you what I’m doing with my own portfolio. So, I’m just going to jump over to my trading system software. And so, this tracks…this not only identifies new opportunities. It also tracks the opportunities which I… the stocks which I had opened. So, this is a stock called Kelly Partners Group. It’s not in the all ordinaries. This is in the ASX. It’s an ASX stock but I don’t think it’s quite made it in the all ordinaries yet. Maybe it has but if it has, it’s only at the…you know, it’s only just, just in there. So the all ordinaries is of course the top 500 stocks. And so now the point I want to make with this is that it’s…look what this stock is trading. It’s trading up near its 52-week highs. So, we’re looking at the Nasdaq, we’re looking at S&P 500. We’re even looking at the all ordinaries saying, “Look, this market’s pulling back. What am I going to do? Looks worrying.” But then I look at the stocks in my portfolio and then I… I’ve got a number of stocks which are in these big uptrends which are up near their 52-week highs. They are the ones which are hitting towards their exit stops. Now we’ll close those out if they hit the stops.
But then, you know, I’ve got these ones at 52-week…near 52-week highs. So, I’ve had this stock on board since the 11th of August, 2020. So, you can see my entry here. So, I’ll just scroll back a touch to give you a little bit more perspective. So, look, this was a stock, an obscure stock. No one was talking about it. You can see where the moving average is cross here and then it breaks to, you know…break to a 70 day high here. And oh, here. Here was the 70-day high. And that was my entry trigger. You can see the red line beneath it. That’s my stop loss which then becomes a trailing stop. Interesting, isn’t it, you know? An obscure stock. The only way I found this is because I do algorithmic scans across the entire ASX each day and that identified the characteristics which give the potential for a significant uptrend. And that drew it to my attention. I’ve never heard of Kelly Partner Group prior to that. So, I can thank the algorithms for identifying this one.
And look, and it’s had a good run. You can see how the price is moving up. And you can see the trailing stuff beneath it. So, I’ll just come back to where we are now. I’ve been in it at a dollar. It’s now at $4.50. So that’s a pretty good move for what? An 18-month period, thereabouts. Now, this is a thing with my trailing stop. They’re wide trailing stops. Some people go, “Oh, you risk too much. You risk giving too much back with a wide stop.” But the reason for a wide stop is it helps keep you in and it helps ride off pullbacks in the market. So, like, you look at this point here during that October pullback we had. Had I not had the wide stop, I would’ve been out. It only just held in as it was but the wide stop gave it enough room to move around and now it’s off at a new all-time high. What’s going to happen here? Well, maybe this is it. Maybe it is going to make its way down to the trailing stop and I’m going to be out. Then again, if the market pulls back 10%, maybe this stock comes back. Maybe it comes back to $4 and then rallies again. We don’t know. We don’t know how far a trend’s going to extend.
Just like here. At this point, I was up something, like, 50%, 60%. It’s like, “Well, that sounds like a good profit. Should you take it?” But this is the thing. You never know how long a trend’s going to run. So that’s gone from up 60% to up, you know, 400% or something. So, you know, let your winners run. Give them room to move. But have your clear exit point for when conditions do change.
And just quickly one more stock. GR Engineering. So, I think they’ve gotten involved in the mining sector. I’m not sure. I actually don’t do a lot of fundamental research in the stocks I buy. I’m pretty much basically just going off the price action. So, another stock which I hadn’t heard of prior to entry. It also goes back to August, August 2020. So, it was another one of those stocks coming off the COVID crash lows. So yeah. You can see how…like, I don’t get the low. I never do. It’s not about getting the lows but waiting for those moving averages to cross, waiting for a 70-day high. Seventy’s not a magic number. It could be a 60-day high, an 80-day high, a 50-day high. But 70’s the day for me. And then the uptrends kicked in. And just like with that Kelly Group, you can see the wide trailing stop. Even more so with this one. Had I been running a close stop like, you know, 10% or something, I would’ve been…you know, I probably would’ve been out here at this point with barely any money. But, you know, it soar up. That pulled back. That one. Just soar off, this one. So, it doesn’t work with laser accuracy. Sometimes it will just clip it and you’ll be out. But in this case, you know, it’s been on the right side of getting close. You know, kept me in there.
Then you’ve got that October. When was the October…it actually held in quite well during October. It didn’t come back too much but we had a bit of a shakeout in December. Came back. but, you know, that wide stop kept me in there. And still now close to 52-week high so it doesn’t look like the Nasdaq, doesn’t look like the All Ordinaries. So, you know, this is a thing. Just because the market’s looking shaky, I don’t want to start selling up my portfolio, particularly when it’s so…there’s so many…I’ve got, you know, a number of stocks which are, you know, considerably above their trailing stops. So rather than preempt that there’s going to be a turn and an exit like I could’ve done anywhere through here but I didn’t, so rather than preempt that this is going to come back to the trailing stop, I’m going to wait for the market to tell me. I’m going to wait for the market to actually come back and trigger the stop. You know, by the time it triggers, maybe the stop’s going to be here, maybe it’s going to be here, maybe it’s going to be up here somewhere. We just don’t know.
But I know the way I maximize my profits and the way my portfolio outperforms is because I let…when I get these big trends, I let them run and I give them room to move. You know, for me, that’s the key to the whole thing, making it all work and getting a… like, my portfolio has outperformed the all ordinaries over the last six years by I think something like double. And just because…look, I’m using a straightforward strategy. I’m being disciplined with it. And, you know, I let my profits run. I cut my losses. Give my winners room to move. You know, all that sort of stuff.
And look, if you’re interested to know more and sort of, like, find out more about how I identify these entry signals, how I, you know, calculate the exists, you know, you want to see the trailing stops in action, it’s a… maybe just sign up for a two-week trial of my Motion Trader service. You can do that from the front page of the website, motiontrader.com.au. It’s only $9.95 for a couple of weeks but I think you get a lot out of that just by that alone, you know, and understanding, like, how these things work.
Okay. More than enough said. Let’s call that a wrap for this week. Thanks for joining me. Hope you got something out of this. And I look forward to coming back. We’ll see how many more pieces of the puzzle we can put back together next week. So, thanks for joining me and bye for now.
Meet Jason

I'm Jason McIntosh, the creator of Motion Trader. My career began in 1991 on the trading floor at Bankers Trust. Nowadays, I trade my own systems from home in Sydney.
Motion Trader is for investors who value robust analysis, data driven entry and exit signals, commentary, and education. I use engineered algorithms to identify when to buy and sell ASX stocks. No biases or guesswork, just data driven signals.