Trade the Trend | Episode 23
By Jason McIntosh | Published 14 January 2022
Trade the Trend is a weekly video focusing on where the stock market is going. It’s for investors and traders looking for insights to the market’s next move. Jason uses technical analysis and trend following techniques to help you piece together the world’s biggest puzzle.
Where is the Stock Market Going?
00:00 Intro
00:21 Where is the S&P 500 going?
04:44 Is the stock market diverging?
07:20 Where is the ASX 200 going?
10:02 Should I buy the dip (or has the trend changed)?
14:30 Don’t buy the dip when this happens
Where to invest now?
Looking for ASX stocks to buy now, as well as off the radar ideas most people don’t know? Our algorithms scan the stock market daily for medium term investment trends. We then tell our members precisely when to buy shares. And most importantly, we tell them when to sell.
If you’re ready to get started, try a no obligation FREE 14-day trial of Motion Trader, and see what an algorithmic trading approach could do for you.
Transcript
Please note: Charts available from video
Welcome to this week’s edition of “Trade the Trend,” a weekly video discussing where the stock market is going. I’m Jason McIntosh. It is Friday, the 14th January 2022. As always, this is a general commentary and doesn’t take your personal situation into account.
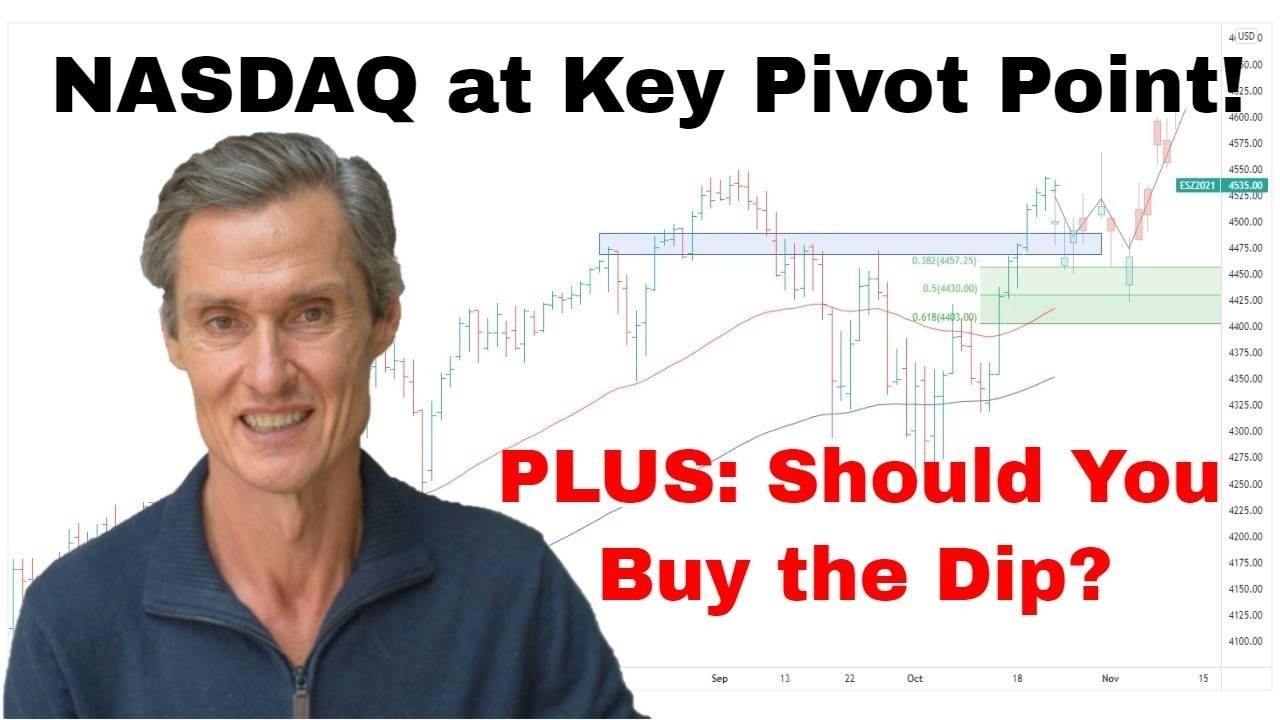
I’m going to start today with the NASDAQ. I think it’s a really interesting point to start because the NASDAQ is really sitting at a key technical level. And I think what happens over the next…look, maybe what happens over the next week or two could really set the market up for what’s going to happen maybe over the next month or two. So, really important to have a look at this.
Let’s get some lines started on this chart. So I did show you this last week. It’s a trend channel. Now, let me just draw it all in. I just want to do it carefully so I get the right connections. I think that’s about it. Yep. Now, we just fitted a little bit better back here.
So, yeah, look, that’s a pretty good fit, I think.
We’ve got this trend channel. And it dates back quite a bit. It goes back about…oh, look, it’s about a year and a half now, back to around September, August, September 2020. And it’s really contained the market well.
What I like so much about this is that it’s got all these touchpoints along the way. So you can see these areas here where, you know, the market’s come back. It’s tested the base of this trend channel, like, on all these occasions, and then on each time it’s rallied.
So that’s what…it’s not quite the right one. So this is what makes a good trend channel, where you get all these points. And you can see you’ve got another one up here as well. And then you’ve got the touchpoints on the top, several touchpoints on the top.
So the more of these times where the price action comes back and actually meets with the trend line, it makes it all the more significant. I think you really need at least three points on the trend line to make it of use. And I think, look, a mistake a lot of people make is they draw trend lines where there’s only maybe one or two points, and those trend lines really don’t mean a great deal.
I think that’s probably why a lot of people get frustrated with technical analysis and they move on because they’ve seen it done incorrectly, done it incorrectly themselves, and the whole thing doesn’t really work. And so look, that’s the thing. Makes sure you got all your points there.
And so look, let’s look at where the NASDAQ is now, zoom in on this. And the NASDAQ is really…it’s really testing this lower boundary here. Look, so I’m recording this on Friday afternoon in Australia. We’re going to see what happens in the U.S. overnight on Friday there.
So, the market could…look, by the time you’re watching this, the market could have fallen or it could have had a rebound. We have to wait and see, and just see how that all pans out.
But look, the possibilities are really that we either…we’re either going to see the market, you know, respect this trend line again and start to rebound and start making its way back up towards, you know, the upper boundary or it’s going to do the opposite. We’re going to run…and this is the concern that we see, that we do get maybe a little bounce off that, and then we crack below it.
Look, I think that’s very much on the table. It’s a scenario which we have to seriously consider is going to happen. And also we’ve got…just here, I’ve got the 200-day moving average. Now, the NASDAQ hasn’t been below the 200-day moving average really since this market started. You can see back here just after the COVID crash was the last time we were below the 200-day moving average.
So, if we do duck beneath there, look, I don’t think that would then set the market up for anything completely terrible, but I do think it would lead to…maybe we get that longer consolidation that people have spoken about for quite a while now. Look, we’re going to have wait and see. I’d like to tell you which way it’s going to go, but of course, I don’t know. We’ve got to let the market show its hand and see what it does, but it’s, you know, definitely a pivot point that we’re watching at the moment.
All right. Now, I want to show you something else, which I think is quite interesting. I’m going to jump across to the FAANG index, just waiting for that to load up. And what I want to do now, I want to look at the…something I like to look for in markets is divergence. And so here’s the FAANG index. And the FAANG index, it’s an index of some of the biggest tech names. It’s got about eight big tech names in there. So these are mega-cap like Apple and Alphabet and Amazon, all these really big ones.
And now, what I want to do now is I want to compare it to the Dow, yeah, the Dow Jones. Let’s compare it to the Dow. So this one here, let me try that again. It’s this one here, get a new scale. Right. So, up the top, we’ve got our…let me just move the Dow down, here we go. Okay. So at the top, we’ve got the Dow. You can see it’s been making…it recently made a new high, high here and a higher high here.
When we look down here on the FAANGs, you know, this big mega cap index of the tech stocks, we can see we’ve got a series of declining highs. So that’s what we call divergence. Divergence doesn’t mean a market is going to peak and then go into a bear market. Divergence sometimes just works its way out. Other times, it’s a sign that there’s going to be a pause in the market, and there does need to be more consolidation.
So this will work its way through probably one way or another, either things are going to catch up, which would be the bullish case that does…you know, finishes this decline around here and starts to, you know, move up towards new highs. Alternatively, it’s going to be the S&P which catches up and aligns with the tech stocks.
And we do see the market come back down here, which would fit into that, you know, possibly, you know, what we’re seeing in the NASDAQ. So, you know, you just got to wait and see, wait and see how this plays out. But look, there are some warning flags out there. So I think it’s a time to…look, it is a time to trade cautiously with what you…you know, with your portfolio and the stocks that you’re bringing into your portfolio and also that you’re exiting from your portfolio.
So with that said, let’s jump over to the ASX 200. And we can get rid of this comparison now. There we go. Back to the ASX 200. Now, I’ve got the other trend lines, which we’ve been looking at previously, which gave us this converging trading range called quarter triangle. And we got the bullish break out of there, round about that new-year period. We’ve come back, we’re testing this upper boundary of the range again, which isn’t unusual in itself, but the market now is at a key pivot point.
It’s like, “Is the market going to hold here and then continue upwards, or is it going to invalidate the pattern and break back down below…?” Look, I think a break back down below just on these lows here, that would be enough for me to say, “Look, this pattern isn’t working out.” And then we’re back in the chop and mess of this trading range.
Maybe the market will then pull back towards its lows, I don’t know. That’s getting ahead of ourselves. We’re not there yet, but this pattern really is on the edge of either it’s going to work or it’s going to fail.
The way I’m playing this, I’m still long on the market. I’m going to continue to do so whilst the market gives me a reason to do so. The broader longer-term trend is still up both in the U.S and in Australia. It’s just a case of are we pausing here to consolidate or are we continuing higher? And that’s what we’re really watching these levels for. So I’m still long. I can continue to do so. I got my trailing stops in place and whilst they’re intact, I’ll be in the market.
And look, it was interesting over the last week to see my Motion Trader service give quite a few signals to buy stocks in the commodity sectors. So this is across different metals. There were signals for copper stocks, iron ore, nickel, there were some energy in there.
So it’s quite a broad-base selection of signals across the commodity plays. So, there is momentum in the local market, but it seems to be very much stock and sector-specific. So, I think it’s really a case of watching momentum closely and making sure you’re on the right side of it.
And look, if you’re getting some value out of the video, please as always, please hit that like button, please leave a short comment, just, “Hey, thanks for the video.” Just tells YouTube that people are watching and people are engaging. That helps me because YouTube then makes it available to other people. And yeah, if you haven’t hit the subscribe button with the notification button as well, that’s also a good thing.
So, now, I want to finish up with a word on exit strategy. So, a few weeks ago, we’re speaking about a stock called Magellan Financial Group. So let me just find it here, and here it is. Talking about Magellan, and it had just been in the news because it just had this big downdraft here, big down day, fell 30%, 30% in one day, so it made the news.
And, you know, we’re talking about exit strategy, really interesting over Christmas. I was hearing from…it’s actually from a family member. He was telling me how himself and a lot of his friends and his broker, they’d all been buying a lot of stock in Magellan Financial Group on the basis that had great management, and yeah, this must be a bargain and they were sure it was all going to turn around.
And look, it just reminded me how often people disregard price action when they’re making their decisions in the stock market. And they think that a falling price is positive because it must be getting…must be becoming a bargain.
And, you know, sometimes, you know, if you get the underlying trend correct buying the dip, yes, it certainly can work, but if you buy a stock like this, which is well past buy the dip time, you know, it can turn into a disaster. And so what I want to do, I want to look at another stock from this week.
So our current stock, which is relevant to this discussion, it’s Domino Pizzas. So, this is interesting because…let me just get rid of a couple of things here. This is interesting because it’s broken down this week, and it’s similar to Magellan Financial Group maybe 6 months prior to its 30% down day.
What we see with this, I’m going to put on some moving averages that’ll actually help with this. I think… Let’s just call up some moving averages here. So I’ll use some the double EMAs to do this. So there’s a 200, let me just adjust this to make this a 50, which is the one which I typically use. There’s the 50, and I’m going to change this to a 100. I think the 15 and 100-day combination actually work really well for medium-term trend following.
So look, yeah, it’s an interesting chart to look at because what we have here with Domino’s is that we’ve had a long-established uptrend and now it’s rolled over and started to decline. You can see the moving averages have crossed over, which is of course a negative sign.
And then it’s also interesting to look at this because you can draw quite a well-established trend line up through here. So you’ve got this good trend line here as well, which is now broken, broken to the downside. And it’s also broken below a support region through here.
So you’ve got three things going against Domino’s, a break of the trend line, moving averages crossing, and a break of a support zone. And just like we were talking about earlier with the NASDAQ, it’s got all these touchpoints on the trendline, so it’s quite a significant trendline to break.
What a lot of people will do here it’ll be they’ll trade it like they traded Magellan. They’ll buy. They’ll say, “This is cheap, I’m going to buy.” But what a lot of people don’t notice is that the underlying trend in this stock at this point at least has changed. It has changed from an uptrend to a downtrend, and buying now is quite a dangerous strategy and it’s…I think what it does, it increases the odds of a nasty surprise where a stock does quickly fall, you know, 20% or 30% like we saw in Magellan. So it’s a sort of thing you really got to be aware of.
Want to just quickly jump over. I’ll just show you how I handle these situations in terms of, like, how I exit stocks. So just looking at this. This is a trade from my Motion Trader service, which, you know, I sent this out as a buy signal to the members back in August 2020 thereabouts. So the moving average has I said like the trend has changed.
The underlying trend had changed to the upside, the moving average had crossed, price’s breaking up to a new high, so that was a buy trigger. This line below here is the exit stop, which then becomes a trailing stop.
Now, if we follow this along here and you’ll notice the whole way up, the moving average is a positive. So if you’re going to buy a dip, if you’re going to try and buy a dip, you want to buy a dip when the moving averages are positive because that puts you on the side of momentum. And now, we just watch this continue along.
Now, you know, using the wide trailing stop, there are a couple of points where it came in close, came in close here, but then rallied again, fill again, started to just consolidate sideways, get a little bit more room there, start to move sideways, but it didn’t kick back up this time. This time, it rolled over, triggered the exit stop, and it’s continued to fall.
The moving averages now look to be rolling over. This is when I wouldn’t want to buy a dip. There’ll be people thinking in Pinnacle like they are in Domino’s, “Now is the time to buy a dip.” But you buy the dip when the moving averages are against you, or the stock is below the moving averages, you’re running the risk that, you know, you really do head into trouble.
So look, I think now’s the time just to tread a little bit carefully. If you’ve got stocks in your portfolio like Domino’s, like Pinnacle, then maybe it’s a time to…you know, maybe it’s a time to consider exiting those and moving into cash, looking for the opportunities which have the momentum.
And if you want to know a bit more about how I identify trend changes and how I apply the exit strategies, jump over to my website at motiontrader.com.au because I’ve got some free training there on the website which may help. Okay. Well, look, let’s call that a wrap for this week. Thanks for joining, and again, let’s come back next week and try and put all those pieces together again. Okay, till next time.
Meet Jason

I'm Jason McIntosh, the creator of Motion Trader. My career began in 1991 on the trading floor at Bankers Trust. Nowadays, I trade my own systems from home in Sydney.
Motion Trader is for investors who value robust analysis, data driven entry and exit signals, commentary, and education. I use engineered algorithms to identify when to buy and sell ASX stocks. No biases or guesswork, just data driven signals.