These ASX Stocks Set to Rally | Episode 78
Where is the Stock Market Going?
00:00 Intro
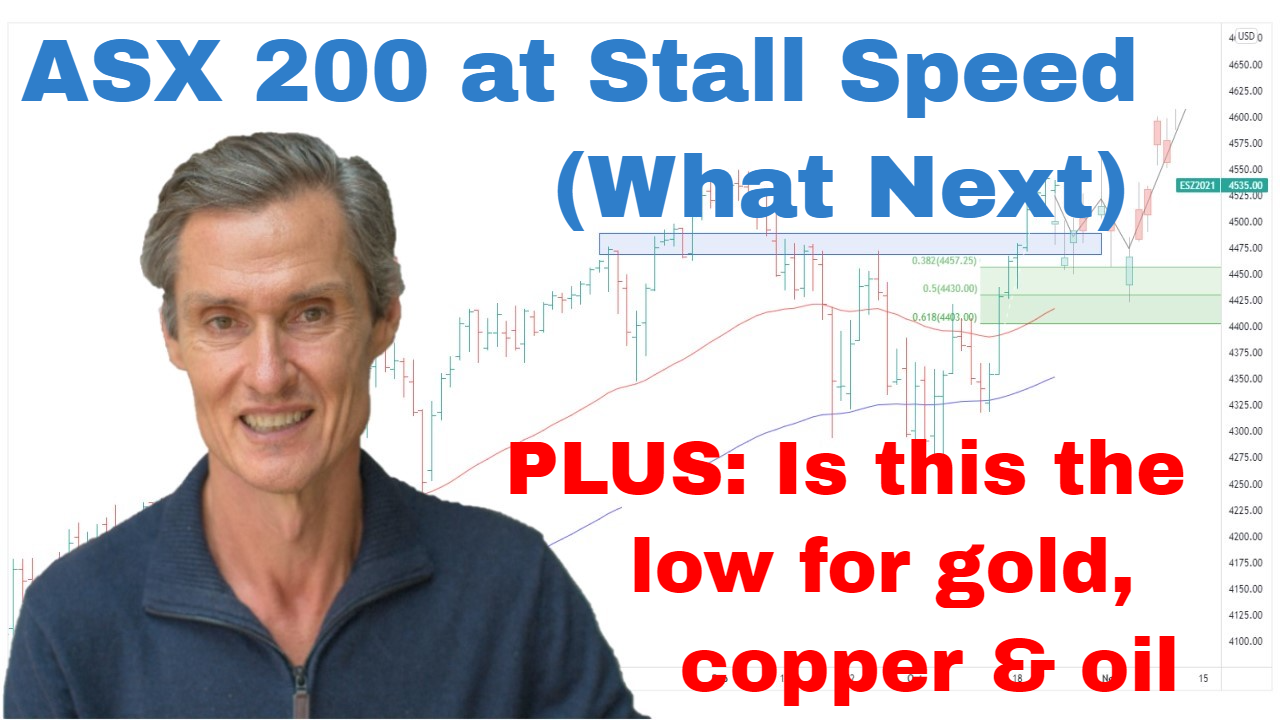
00:30 This key indicator explains why the ASX 200 is stalling
02:50 Consider this approach for buying the bigger stocks
03:26 Small Ords bounces off level level (what happens next)
06:36 This is the biggest headwind for commodities
09:12 The latest set-ups for gold, copper, and oil
Transcript
Please note: Charts available from video
It’s been a pretty interesting week for the ASX 200. The upward momentum that we had off these lows a couple of weeks ago has really started to stall out around the 50 and the 100-day moving averages. And this is something we…We actually see this price action quite a bit. It’s like during a decline, the moving averages often act as a resistance point, and that’s because as prices approach the moving averages, it often attracts sellers, particularly when you’re looking at moving averages like 50 and 100 days. These are typical moving averages that traders and investors will look at when making their decisions. And when this selling pressure comes in, it then, of course, weighs on the market price. The opposite thing occurs during up trends.
So, just looking at this period of rising prices during 2020 and 2021, as the price comes back to the moving averages, that’s when people who like to buy the dip, they tend to get more active and they buy the dip. And that strategy works quite well. It actually worked very well in an upward trend. Opposite applies in the downtrend. So, here we are with those moving averages weighing on the index price. And so I think it’s really important to be aware of the position of the moving averages in relation to the price of either a stock or an NC, whatever it may be. Be aware of the price in relation to the averages.
And the other key feature on this chart is, of course, the double bottom support that we have down here at 6400. So, we’ve got this situation now where the ASX 200 is really now wedged between the moving averages above it and the double bottom support below. So, it’s somewhat in…you’d say it’s really in a bit of a neutral zone. I think the risk-reward in either direction, it just doesn’t look overly appealing at this point. And I think as far as the largest stocks go, I think it’s a case of being very much stock-specific at the moment. I think it’s about looking for stocks that are trading above their moving averages. You want stocks in this trending phase above their moving averages and that have positive momentum. And I think if you do that, if you’re scanning for stocks that way, I think you can narrow down the field considerably, as opposed to coming in and trying buying the low in stocks which are below those averages.
Now just jumping over to the small ordinaries and having a look at what’s going on there. And it’s interesting to see the price action bounce this week off this level. So, what I want to do, I want to put the Fibonacci retracement levels on from this rally from the low a couple of weeks ago. And you can see the rally that we’ve had this week has come right off the bottom of the Fibonacci retracement range. And what’s interesting there is that I think this keeps open the window for an extension of the rally off this low we had a couple of weeks ago. So, maybe an extension up towards into this…start us in towards this moving average range, which is currently…the midpoints are currently around 2800 for the small ords.
And the small words, it’s really been one of the hardest-hit sectors this year. So, you look at this decline and it’s currently down around 26% from its highs. I think that provides solid rebound potential for this market, but I think at this stage, I think we really need to be wary of bear market rallies. And the thing is price is currently below the moving averages. So, when price is below moving averages, it does make it vulnerable, and I think it does increase the risk. And while I think this is certainly a section of the market to watch and it does have rebound potential, I think our default position has to be that the primary trend remains down while we have the price positioned relative to where the moving averages currently are.
So, I think it remains a case of continue to exercise caution. I’d love to say that the bottom is probably in, but we simply don’t have the technical evidence to make that call. It’s really guesswork to say, “Let’s go for a low here.” There’s no evidence, well, nowhere near enough evidence to support such a proposition. So, the thing is you just can’t rush bear markets. The bear market is going to play out on its own time. Our job here and now I think is to stay cool and play it defensively and make sure we’ve got plenty of capital intact when we do get more concrete signs that the market is starting to gain momentum to the upside.
Now, I’m going to have a quick look at commodities in a moment. But first of all, if you’re getting some value from this, please hit that like button. Also, leave a short comment, just “Hey, thanks for the video.” It tells YouTube people are watching, people are engaging, and YouTube then shows more people. So, that helps immensely if you can please do that. Hit the subscribe button. Come over and visit me at motiontrader.com.au and see all the stuff that I do over there that might be able to help you with what you are doing in the stock market.
So, okay, commodity time. Well, before we start on commodities, let’s start with the U.S. dollar. This is a monthly chart of the U.S. dollar going back to 1969. And the U.S. dollar really is currently, I think, the number one issue for commodities. And what we’ve seen here over pretty much the course of this year, it’s one of the sharpest increases, the sharpest rallies in 50 years of U.S. Dollar Index history. So, the U.S. Dollar Index is the U.S. dollar against a [inaudible 00:07:15] of currencies, including the Australian dollar, the euro, the yen, the pound, all the big currencies, Canadian dollar, they’re all in there.
And yeah, it’s one of the sharpest rallies we’ve really ever seen. And so interesting in that over the last few years really, there have been so many people saying that all this quantitative easing, all this money printing was going to lead to this giant inflation episode and a collapse of the U.S. dollar. Well, we got the inflation, but we didn’t get the collapse in the dollar. We’ve got this huge historic surge. So, it just goes to show that markets, they’re just so un-intuitive so much of the time and why you shouldn’t have fixed and certain ideas in what you believe is going to happen. You’ve got to be flexible because things can often play out much differently to what people are looking for, including what you’re looking for yourself.
And just going to a weekly chart. There’s no technical measure to say where this rise in the U.S. dollar is going to stop. We could say that prices are currently stretched well above the 50 and 100-week moving averages, and at some point, the price will come back and retest those averages. But there’s just no telling where that’s going to happen from. You look at 2014, 2015, for example, prices were really stretched here. And you could have made the same case, saying, “Prices are really stretched, they’ve got to come back.” But the market did continue up for several more months. So, we just don’t know. And that’s the thing with these trends. Trends can stay in place for longer and go further than just about anyone thinks possible. And this is the headwind we have with commodities.
Just quickly going through a few of them. Let’s start with gold. And I’ll go back to our daily chart. And what we’ve got with gold, we had this breakdown below this two-and-a-half-year support line about a month or so ago. Prices got back, broke back above that support soon after, and opened up the possibility, was this a false break? But now here we are again, we’re back down retesting the lows. So, gold is below the moving averages again, so we’ve got a downward trend in place. Looking at the gold stocks, they look so overstretched to the downside. Some, in particular, some more than others. And you can really see the potential for a big rebound to the upside, but where does that come from? Does it come from here, or does it come from 50% lower? You don’t know. So, I think it’s just too much risk trying to play gold and gold stocks from the long side at this point in time.
We go across and we look at copper. And again, it’s another one of those commodities I think which has a great medium to longer-term story, but it is in a vulnerable position at the moment. We’ve got these moving averages. Price has been testing the moving average over the last several months. We’re now at a point where we’re wedged between. You can say we’ve got support at the September low and we’ve got resistance at the moving averages. Which way is this going to break? If it does break below the September low, it does open the possibility that copper has another leg down. That’s certainly a risk with copper stocks, not the prediction, but it’s the possibility you got to be aware of if you own copper stocks or you’re looking to buy copper stocks. We don’t have that concrete price action to say the momentum is now to the upside. We really need to be breaking above this October high to at least be giving some positive sign to sustain the move. And whilst the U.S. dollar is such a headwind, it is difficult to see that happening at the moment.
And even looking at gold, which has been one of the stronger commodities over the last couple of years, even just now, it tried to rally during October, it got to resistance around 92, and it’s come away again. I think oil’s got a really strong medium to longer-term story. If we can see oil break back above this resistance point, well, then it starts to present some interesting possibilities. But while it’s below the moving averages, it’s below the resistance, again it’s the case that strong U.S. dollar being that headwind. So, I think, for now, it’s just one of those markets where we have to tread carefully. The opportunities, unfortunately, are few and far between. I’ve no doubt they’re going to come. We just don’t have them at the moment. I think it’s a case be patient, keep it cool, and wait for the price action to give us the signals.
Please see video for more details analysis and charts
Looking for the best ASX stocks to buy now?
Motion Trader‘s algorithms scan more than 2,000 ASX stocks daily in search of medium term investment trends. We then tell our members precisely when to buy shares. And most importantly, we tell them when to sell.
Try a no obligation FREE 14-day trial of Motion Trader, and see what an algorithmic trading approach could do for you.
Meet Jason

I'm Jason McIntosh, the creator of Motion Trader. My career began in 1991 on the trading floor at Bankers Trust. Nowadays, I trade my own systems from home in Sydney.
Motion Trader is for investors who value robust analysis, data driven entry and exit signals, commentary, and education. I use engineered algorithms to identify when to buy and sell ASX stocks. No biases or guesswork, just data driven signals.