These ASX Stocks Are Powering | Episode 84
Where is the Stock Market Going?
00:00 Intro
00:30 What this week’s price action means for ASX 200
02:58 This is my preferred way to play the local market
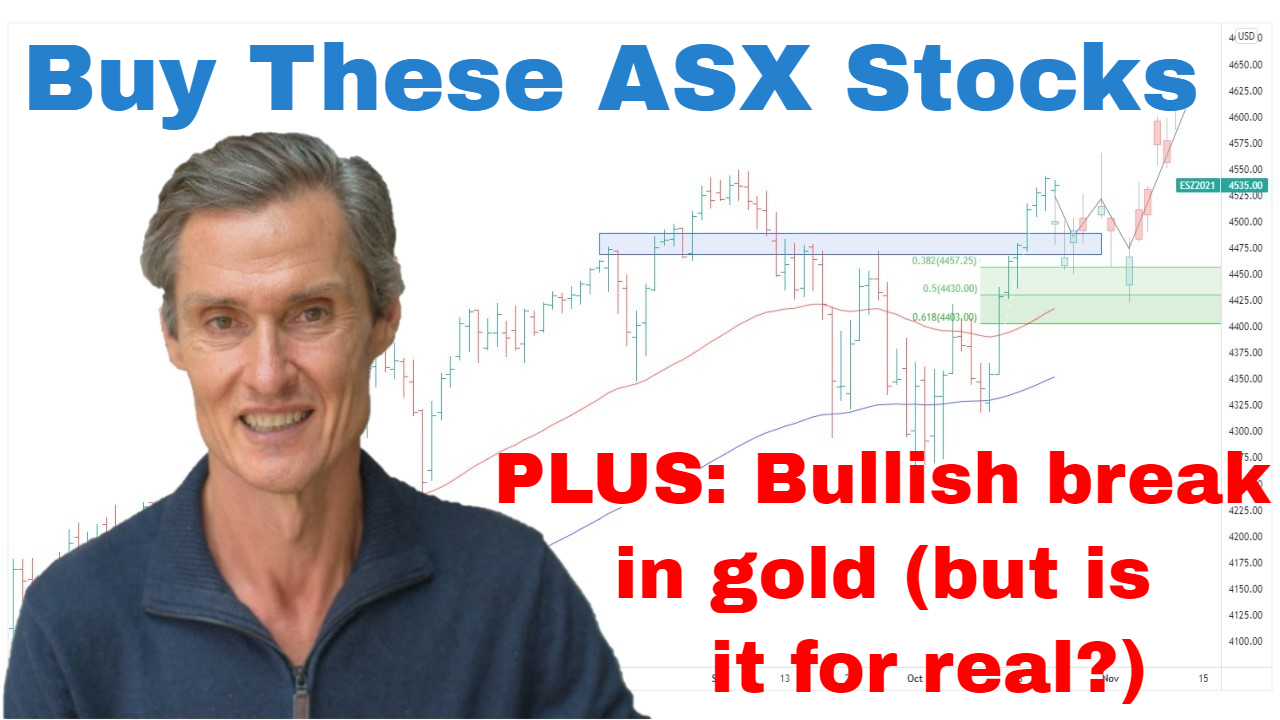
05:54 Is this the start of the next gold bull market? (I’ve seen this set-up before)
09:25 Look what silver and copper are doing
10:16 This is what I’m seeing in individual gold stocks
Transcript
Please note: Charts available from video
And it’s been another week of positive price action for the ASX 200. And so what we have here, it’s really strengthened its position above the moving averages. So, I’ve got the 50 and 100-day moving averages on the screen. And what we also see, these moving averages are now starting to turn upwards, which is a positive sign. And depending on what the price action does, it may only take another two or three weeks for these moving averages to cross. And when the moving averages cross, it’s a sign of underlying positive momentum. So, it’s an encouraging setup for the ASX 200. That said, I’m hesitant to buy into the index at current levels. I think the overall outlook continues to improve, but just looking at the setup, I think the near-term upside for the index, at least, may be limited.
So, there are a couple of things going on here. Firstly, we’ve got the extent by which the index has extended above the moving averages. When we get a situation where the index is below the moving averages, it rallies, crosses over, and flips to the top side of the averages, often we find there’s a pullback towards the averages. And the averages work a little bit like gravity in that respect. So, I think that there is this possibility of getting this return move back towards the averages.
And there’s another thing going on with resistance. There seems to be a resistance band around about the 7200 mark, which is just above the market. So, I’m going to sketch in where I think the resistance is. It’s not a precise level the way this works out, but what you see, you see that this approximate band, it picks up a high point here, picks up some low points through here. There was activity around here a little bit either side, again through here. Here, it overshoots a bit. It is a bit of an active area, 7200. So, I think with the index approaching this point, also extended above the averages, it makes me think that there is a potential for the index to pause. And so rather than buy say an ASX 200 ETF, my preference would be to look for stock-specific opportunities, stocks with the right setup given the improving environment that we’re seeing for the ASX 200 generally.
On the index front, if I were to look at an index which I was interested in getting more exposure to, it’d be this one here. This is the ASX small ordinaries. And what’s interesting with this one is that this rebound off the September low continues to gain momentum. Price is now above the 100-day moving average, so we have a positive sign there. Moving averages haven’t yet turned higher. They haven’t yet crossed, but it looks like the 100-day moving average and also the 50, they’re starting to flatten out, which is the first stage in turning upwards. I think the recovery potential in these smaller stocks is greater than in the larger stocks.
We’ve also got this support area coming through here at around 2780. Picks up a couple of highs here from back in July. Another high point, some activity in recent times. So, if I were to establish a position in the small ordinaries… I actually do have a position in the small ordinaries which I put on a couple of months back. If I were to add to it, it’s an easy point to work out where my risk is. I could have a stop loss just beneath this support band, and upside I’m looking for potentially a move towards this resistance band at around 3100. So, it shapes up as an interesting setup in those smaller names. And it’s been interesting because I’ve been seeing an increased number of buy signals for stocks with less familiar names turning up in my algorithmic scans which I’m doing through my Motion Trader service. Stocks outside, maybe at the lower end of the ASX 300 or even outside the ASX 300 or, in some cases, outside the all ordinaries. So, I think there is some interesting movement in the individual stocks as well as being supported by a broadly more positive positioning in the indices generally.
So, if you’re getting some value from this, please hit that like button, please leave a short comment, just “Hey, thanks for the video.” It just tells YouTube that people are watching the videos and people are engaging, and then YouTube shows more people, and that really helps what I do. So, I make videos so people can watch and people can understand the setups and the possibilities I’m seeing. So, please do that. It helps me so much. And also, come over and visit me at motiontrader.com.au and see if anything that I do there might be able to help with what you are doing yourself.
Now let’s move on from the indices. Let’s move on to gold because gold has had an interesting week. So, here’s the daily chart of gold. And if you’ve been watching my videos for a while, you’ll be familiar with this support band through here at around 1680. So, just going through the setup that I’m seeing. So, this is interesting on a couple of fronts. So, firstly, we had this breakdown in late September. The break didn’t hold, market rallied back, had another attempt at breaking down in October, and again there was no follow-through selling. And now we’ve had a strong rally back above this support point. So, this is particularly interesting because it’s a bullish sign when a market breaks below a support. On this occasion, it’s broken down twice and it can’t attract follow-through selling. Because what that indicates, it indicates that there is no more selling that really needs to be done or sellers will become resistant to selling. And the volume has really dried up on the downside. And when that happens, it can cause a market to bottom and then turn higher. And I’ve seen this setup lead to many big rallies over the years. So, it doesn’t guarantee a big rally is going to eventuate from this situation, but it is positive. It’s a positive sign to be aware of.
The other feature which I want to focus in on is this descending trend channel which the market has just broken out from. So, let me just quickly skip to a four-hourly chart just to get a little bit more detail in this channel. Now, the channel dates back to March, clearly defined downward trend channel. We’ve got a number of touchpoints on the top side. You can see there’s four touchpoints on the top side, so it makes it well-established and a channel of significance. And we’ve got this breakout which has just happened during the week. Now, when you get a breakout from these trend channels or any charting pattern for that instance, when you get a breakout, you often get a return move. So, you’ll have the initial thrust higher and the market will pause and it will consolidate above the breakout point. Sometimes it might come back close to the breakout point, otherwise, other times it just might be sideways. So, that’s something to bear in mind that, yes, we’ve had a good strong move. It’s definitely a positive development. It’s making the technical outlook for gold look a lot better than it was a few weeks ago.
But let’s just go back to the daily. But having said that, it doesn’t mean we should immediately expect that this is just going to launch up towards those previous highs. It could still be part of a larger basing pattern which may still require a bit of time to play out. I’m also aware looking at these moving averages. The moving averages haven’t turned high yet. They’re starting to flatten and they’re maybe starting to round, but they’ve got a bit more work before they can actually really turn higher and then cross over. Here we can see that 50-day get up above the 100-day moving average. Going to take a bit more time. That’s why I say this could be more of a larger bottoming process which needs to work through. But the technical picture is definitely improving.
And it also plays out when I look at other metals. Looking at silver, for instance, we can see a nice rounding basing formation taking place in silver after quite a weak period of price action. So, that’s positive. Go over to copper. See something similar. See the market. The market in copper hit a low in July. We had an initial rally, and for the last few months, we’ve just been tracking sideways. Again, this is a bit of a rounding basing pattern there. We’re punched higher over the last week or two above those moving averages. Moving averages appear to be turning. Really interesting space to watch. Also coincides with the U.S. dollar pulling back over the last few days. So, really interesting space to watch in these metals.
And it’s also interesting that I’ve been getting a number of buy signals from gold stocks over the last week or two in my Motion Trader service. So, the algorithms are picking up in the emerging momentum that has been playing out in the gold sector. So, I’ll just give you one quick example. So, this is a stock which turned up in the signals at the start of the week, so a company called Gold Road Resources. So, one of the interesting things is I’m not just spotting the larger companies. There’s also these second and third-tier names which turn up in the scans. So, just compress this up a little bit. Gold Road had been in a big uptrend for some time leading into the high in mid-2020 this was, July 2020 the peak was. So, you can see how long these consolidations can last after a big upward trend. People hope upward trends are just going to keep going and going and going, but they usually don’t. They usually pause for these, sometimes multiyear consolidations.
So, where we have it now, it bottomed in July this year, had an initial rally, then went through a sideways process, and that gave those moving averages time to stabilize and start to turn higher. We got the cross early this week. The moving average crossed and turned upwards. So, the 50-day got above the 100-day showing that underlying momentum, and then we got a breakout at the start of the week. This is where I got a buy signal. Now, this market has continued to move higher over the last few days. It’s now up here. It’s now actually approaching the upper band of this broader trading range. So, from my perspective, I wouldn’t buy Gold Road just here now. I would have bought it on the breakout, but now it’s run a little bit, stretched quite a bit above those moving averages. So, it’s an example of the setups which are appearing and the potential this gold sector has. It doesn’t mean everything has to be bought on day one. We could get… I was talking earlier about that potential for gold pausing and consolidating that breakout that we’ve just seen from that trend channel.
If Gold Road was to pause, maybe we could get another zigzag back towards the breakout point, and then from there, we start to see more momentum, and then that could take us out of this range. And that’s how you can lead into the next large upswing in the gold sector. So, really interesting things starting to happen in this gold space. This is just one scenario. It’s a case of watching the price action, but the price action that I’m seeing across the gold sector is really starting to get interesting. And yeah, keep a close eye. I think in these situations, it’s also important to remember to be patient. Whilst I say there’s interesting setups, it doesn’t all happen on day one. And Gold Road is just one of a number of stocks which are showing that positive price action.
Please see video for more details analysis and charts
Looking for the best ASX stocks to buy now?
Motion Trader‘s algorithms scan more than 2,000 ASX stocks daily in search of medium term investment trends. We then tell our members precisely when to buy shares. And most importantly, we tell them when to sell.
Try a no obligation FREE 14-day trial of Motion Trader, and see what an algorithmic trading approach could do for you.
Meet Jason

I'm Jason McIntosh, the creator of Motion Trader. My career began in 1991 on the trading floor at Bankers Trust. Nowadays, I trade my own systems from home in Sydney.
Motion Trader is for investors who value robust analysis, data driven entry and exit signals, commentary, and education. I use engineered algorithms to identify when to buy and sell ASX stocks. No biases or guesswork, just data driven signals.