SP500 Set To Breakout | Plus 2 Gold Stocks | Episode 98
Where is the Stock Market Heading?
00:00 Intro
00:45 SP500 continues to coil (which way will it break)
03:44 What this classic pattern could mean for SP500
05:24 This is what the Dow’s price structure suggests
06:16 Nasdaq also has a classic pattern (this is what it means)
08:11 European stocks aren’t doing what many expect
09:04 This is the situation for the ASX200
11:16 Gold, silver, and copper presenting opportunities
13:24 This is my preferred copper play
13:56 Check out these two gold stocks
Transcript
Please note: Charts available from video
This video is going to focus on the U.S. markets, the S&P 500, and NASDAQ. I’ll also have a look at the Dow. I’m going to look at the Australian markets, ASX 200, as well as some of the commodities, gold, copper, and a couple of gold stocks, so make sure you stick around for that. As always, this is general commentary and doesn’t take your personal situation into account.
And as you can see, I’m still traveling. I’ll be home next week, back to normal routine then. At the moment, I’m in the New South Wales country town of Wagga Wagga. Beautiful place. And yeah, it’ll wrap up the family Christmas road trip. So, with that said, let’s get into our first chart.
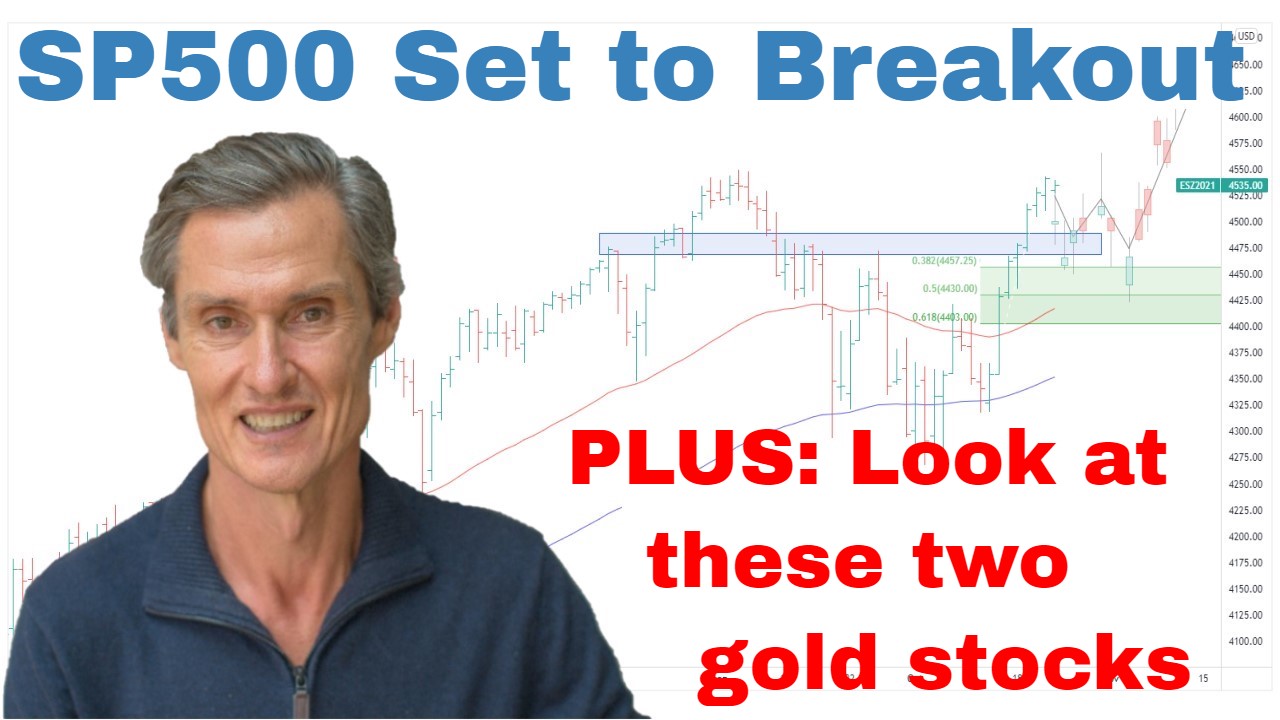
So, we’ve got the S&P 500 on the screen. And it really is so interesting where we are at the moment. It really is becoming a bit of a stalemate between the… On one side, we’ve got the people who are bearish waiting for the market to collapse to new lows below this October low. And on the other hand, we’ve got those thinking that the market can rally into the new year.
At the moment, neither is getting what they want with the market coiling up in this tight trading range. And for the bulls, the frustrating level is this 3900 resistance. And this has been such a pivotal point for the market over the last few months. Really the last six or seven months. It’s really been an area of considerable technical activity. At the moment, it’s pinning the market down. S&P 500 also below these moving averages, so 50 and 100-day moving averages. So, it really does remain at a point of vulnerability.
Let’s jump over to a four-hourly charge. Just get a little bit more detail on this trading range. It’s really formed into what we call a triangle trading range. Let’s draw some levels in that, draw some trend lines in. You can see how the range is contracting, so it’s really coiling up, and that’s building up energy for the next move.
What I’m watching is I’m watching each successive low on the downside and the highs on the upside. And it’s really looking for a break above… Well, at this point, it’d be looking for a break above around 3900 on the top side, or a break below around let’s say 3800 on the downside to trigger a move in one way or the other. And I would expect… If we do see the market break to the downside, what becomes interesting then is, what follow-through selling do we get? And how far can the market extend to the downside? So, that’s the great unknown. I know people want me to tell them.
Let’s go back to the daily chart. I know people get frustrated. Well, some people do, anyway. They get frustrated when I say I don’t know what’s going to happen. And I say that because I don’t. Nobody knows which way this market is going to break. It’s about having your strategy and understanding the possibilities so you can adjust your strategy accordingly. For me, I have long positions in this market. It hasn’t given enough evidence to suggest that we should be going completely to cash. I do have a large cash position, but I’m still playing the momentum from the October low to see whether we can break upwards.
The pattern which I’ve been telling you about over the last few weeks is this is a developing inverse head and shoulders which is a potential reversal pattern, so whether this be a shoulder here, potentially a head, and whether we are forming the right shoulder now. One thing I’ll be watching, if we do break to the downside, if we do get a break lower, I want to see how much follow-through selling we get if the market breaks and we can’t get a big acceleration in downward momentum. And this is what the bears are looking for. They’re looking for a big break to the downside, a big pickup momentum, which then takes the market down to a new low.
If the SP500 does break lower, and it can’t develop that momentum, it then opens a possibility for a quick U-turn and a break to the top side which could take us into the first quarter of new year with short covering and new longs. Whether it’s a new bull market or not, that’s getting way too far ahead of ourselves. Nobody knows that, but it does open that possibility. I can see a possible roadmap which could take this market higher into the next couple of months. So much depends on what happens if and when we do break to the downside is that follow-through momentum.
And also interesting, just quickly put some Fibonacci on of this move from the October low. You can see we are right around that 50% retracement. It does open the possibility of a move down towards the lower end of this Fibonacci range. Just got to wait and see whether that happens. Wait and see what this price action looks like if it happens.
I’m also being guided, as you know, a lot by what’s going on in the Dow. Dow doesn’t have a bearish structure at the moment. Market is still finding support around the 50 and the 100-day moving averages. Still holding above the upper range of the Fibonaccis. And at the moment, this looks like the impulsive move. This looks like the corrective move. So, the Dow isn’t set up for a big sell-off. So, that makes me question the potential for the S&P to have a major sell-off while the Dow is currently structured like this. Not to say the setups can’t change, but at this point in time, I’m favoring that inverse head and shoulders pattern which could be the reversal pattern being the way this plays out at least over the next couple of months.
NASDAQ is interesting to look at because it’s… What’s going to happen here? It’s like one possibility is we’ve got the bearish side is that this is going to break to a new low, and then it’s going to accelerate to the downside. We’ve been through this possibility several times. That remains a risk. It’s not supported by the current structure in the Dow. That’s why I put that as a lower probability scenario over the next couple of months.
I’m wondering if the NASDAQ will form a bullish wedge. It does have that shape at the moment for this to become a bullish wedge. It could withstand a test to the downside but then would need to see that momentum stall quite quickly and start to reverse upwards and then break to this top side. So, again, I can see a pathway which takes this market higher over the next couple of months. So, this is where positioning your portfolio is really important. And I think it’s also important about not getting boxed into a rigid view of what the market has to do next.
Frustrates people when I say the market could go up, it could go down, but that’s the reality because none of us know which way it’s going to go. So, don’t get boxed into one view or another. I think that’s the biggest risk in this market being boxed into a view and finding yourself wrong. So, for me, it’s about holding positions which are above their moving averages, continuing to trend upwards, using risk management to sell them at their rollover, but it’s not about trying to buy stocks or buy indices which are currently trading below their moving averages. I think that’s the greatest risk in this market. This is all about managing risk and being cautious when the market is at a vulnerable point below moving averages.
Going over and looking at…and also just having a quick look at Europe, again the European markets. This is the EURO STOXX 50, the biggest European stocks. Like the Dow, this isn’t set up for a significant or a substantial momentum-based sell-off. At the moment, the momentum has been to the upside, and this is currently looking corrective. Market has pulled back to the moving averages and is rebounding. It’s not set up for a big decline. The big vulnerability in this market was back in September, early October when it broke down, but there wasn’t that follow-through momentum. At this point, we have positive moving averages, market is above the moving averages. It’s not pointing to that big bearish picture which so many people are anticipating. That could change, but at the moment, that’s just not the setup which I’m seeing on these charts.
Now, going over to the ASX 200. Again, we’ve got a market which is bouncing off the 50% Fibonacci retracement, so the Fibonaccis of this impulsive move from the October low, bouncing off the 50% retracement. Structurally, it remains in reasonable condition. It’s not screaming this is really bullish, but it’s certainly not saying the market looks like it’s on the verge of collapse either. Again, it’s about being stock-specific, looking for the strong stocks within this current environment, and avoiding those which are trading below moving averages. So, they’re the ones where I see the greatest risk.
Coming over to the small ordinaries. I said a couple of weeks ago, it might have been last week, that the small ords really needed to find support and bounce. Well, I said it really needed to bounce off this support region at around 2780. So far, we’re getting that bounce. We’re getting back above the moving averages. It still remains… I’m still prepared to give this the benefit of the doubt that we can still see higher levels and a move back up towards this resistance band at around 3080.
Looking at the ASX 200 equal weight, which is also interesting because we had the breakout above this trend line in November, had the return move to the trend line. It was looking like it was potentially going to start to come back within the range. I said we don’t want to see it move within that range, but we’re now getting that bounce. We’re getting the bounce off that support level. And just quickly putting on some Fibonacci retracements, and you can see it’s come right back to that Fibonacci zone and we’re getting the bounce. So, there are some points in this market which are areas to say they’re cautiously constructive. And we should maintain an open mind that the market could rally into the first quarter. The macro-environment remains awful, but the setup at the moment doesn’t appear like it’s about to completely cave in by any stretch.
Going over and looking at some commodities before we wrap up. Gold remains…looking the best has been in since we were back here in February. I’ve been saying that I thought the market may pull back and retest these moving averages, but so far that certainly hasn’t been the case. It continues to push upwards. We had the positive moving average cross back in December. Maybe this is the best pullback we’re going to be seeing in the near term. Maybe gold is going to continue to grind upwards. It’s a case of maintaining position in gold stocks which I have.
Interesting this week through my Motion Trader service, there was a stack of signals for gold stocks which went off in both large-cap and medium-cap gold stocks. So, some really interesting things happening in the individual stocks. And the metal is looking constructive. It’s trading comfortably above the moving averages. It doesn’t look too stretched above those averages at this point, but the moving averages across, they’re trending higher as is the price. So, this remains a constructive environment for gold.
Silver, getting a little bit of a pullback over the last couple of days but the overall structure remains good. The one I’m watching with a lot of interest is copper. I think copper is looking really, really interesting. The moving averages have crossed, the price has come back, has tested those moving averages, and we’re now rebounding. The key is getting above this resistance band at around four. You can see this stretches back to around February ’21. And it’s coiling up. It looks to me like this is getting ready to have a retest of this four region. And I’m expecting we’re going to see it punch above there maybe in the next couple of weeks. I think we can see a break above four. It hasn’t happened yet, so it may not happen, but that’s what I think this coiling price is ultimately going to lead to.
And the way I think is a good way to play this is through COPX, the U.S.-listed ETF, or on the ASX, it’s W-I-R-E. And this has been interesting in the last couple of weeks. It’s been pulling back and consolidating this strong movement we had into the end of last year, pulling back towards those moving averages. We’ve got support just beneath it. It’s looking like it’s getting ready to have another run to the upside.
And just to wrap up, I’ll just wrap up with some interesting developments in gold stock. So, just looking at Newmont. Newmont has been very interesting the last couple of days. I was talking about this I think about two weeks ago. I was talking about how it was consolidating nicely along the 100-day moving average, and it looked like it had formed a bit of a rounding base and was getting ready for a punch higher. So, we’re starting to see that punch higher this week. And I think this can continue to gain momentum here. I think the environment for gold and gold stocks continues to look good.
Looking at Barrick. And it’s a similar setup in that we’re starting to… On Barrick, the moving averages are actually crossing now, the 100 and 50 are crossing, so that’s a positive sign. And we’re seeing this upward acceleration in the momentum. So, I think some good things happening in gold. Looking at the ASX gold stocks. That’s what I’m seeing in quite a few signals in the last week. Some good setups to consider.
So, I think we’ll call that a wrap for this week. It’s always a bit different when you’re trying to do these things when you’re away from home, away from the office, but I’ll be back to normal next week and go back to the two-video format rather than trying to put everything into one video. Hope you found that helpful. Hope that helps you get set up for the new year. Welcome to the new year, and thanks for joining me again, and I look forward to coming back next week and talking to you again then. So, until then, bye for now.
Please see video for more details analysis and charts
Looking for the best ASX stocks to buy now?
Motion Trader‘s algorithms scan more than 2,000 ASX stocks daily in search of medium term investment trends. We then tell our members precisely when to buy shares. And most importantly, we tell them when to sell.
Try a no obligation FREE 14-day trial of Motion Trader, and see what an algorithmic trading approach could do for you.
Meet Jason

I'm Jason McIntosh, the creator of Motion Trader. My career began in 1991 on the trading floor at Bankers Trust. Nowadays, I trade my own systems from home in Sydney.
Motion Trader is for investors who value robust analysis, data driven entry and exit signals, commentary, and education. I use engineered algorithms to identify when to buy and sell ASX stocks. No biases or guesswork, just data driven signals.