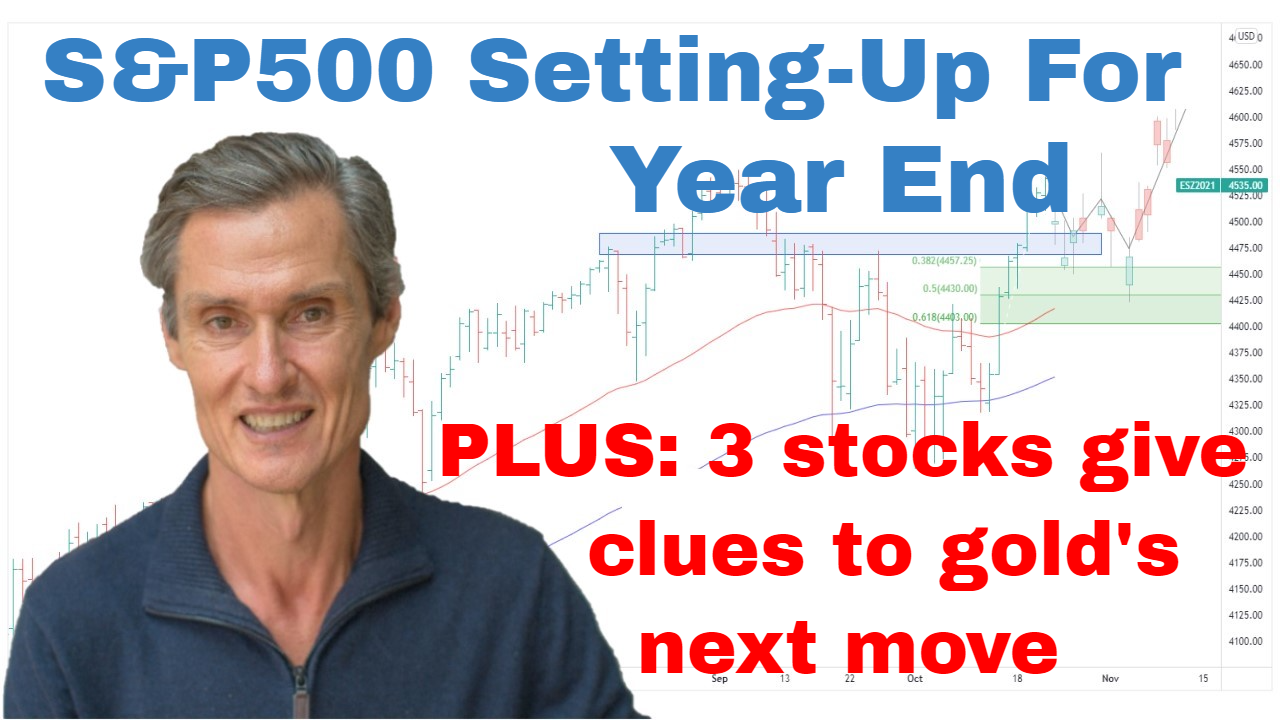
SP500 Setting-Up For Next Move | Episode 86
Where is the Stock Market Heading?
00:00 Intro
00:23 Why my voice sounds awful!
00:47 What the SP500’s recent consolidation means
03:00 The Dow Jones offers its own clues to the markets next move
04:05 Look at the price action in Google, Microsoft, and Apple
07:30 ASX 200 has a classic technical pattern
08:58 Look for this type of price action in gold
11:04 These gold stocks offer important clues to gold’s next big move
Transcript
Please note: Charts available from video
It’s generally been a positive week for the SP500. What’s been positive is that we had that strong move up in the previous week, and now we’ve consolidated and we’ve consolidated in so far a reasonably constructive manner. I think that the key to the short term, at least in the near term, is this support band at around 3900. Ideally, if the market can hold above this support and continue to consolidate, it starts to develop a launching pad for potentially having a run at this down trendline which has been in place since the start of the year.
The other thing which has been going on is that the price action has been pulling back towards the moving averages. I have got the 50 and the 100-day moving average on the chart. And what often happens, after you get a break, once the market is well below those moving averages, you have a run up through the moving averages, you often get a return move. And that’s potentially what we’re seeing now.
And if you remember, last week I was talking about not wanting to add to positions after this strong move up. And the reason was I said, “We’re only about 3.5% from this down trendline,” so it didn’t seem like an asymmetric entry point, and it still doesn’t. I’d like to see how this consolidation continues to play out. It’s feasible that the market could get a pop higher and then still pull back. So, I’d like to see how the consolidation continues to develop.
It’s a case of if you’ve got established positions that you put on at lower levels when the market first started to move up. I think it’s a case of hold those positions and let’s see where this run takes us. It could be a bear market rally still, but it could develop into something else, so it’s a case of giving upside the benefit of the doubt with positions that we add when the setups appear favorable and letting them play out.
And also looking at the Dow is another interesting part of this puzzle because…and this is one of the indexes that we looked at last week in that it’s actually now quite extended above the moving averages. That’s positive that these moving averages are crossing and turning higher, but were also extended above it, and so a big run from the low point below the moving averages through the moving averages up to the recent high. It wouldn’t be at all unusual to see this market consolidate further. You couldn’t rule out that does have another pop higher, but from there, I do think we’re going to expect that we’re going to get some consolidation if the moving average has a chance to turn up and then maybe we get a kick higher from there. So, consolidation allows the moving average to start to turn. But overall, I think whilst I don’t think this is an asymmetric entry point where we currently are, overall, I do think the technical picture is continuing to improve.
We just look at a stock like Google, for instance. So, this is Google’s price action over the last year or so. Because I was talking about this a couple of weeks ago. We had this. It was really crash-like conditions where Google fell something like, I think it was 20% in the space of a week and a half, so a big down move. And this is volume. We saw a spike in volume on this initial part of the move, and we saw some follow-through selling. Volume was still elevated but not as extreme, and then from there, we’ve had a snap-back rally. So, at the moment, it’s got very much a V-shape to it.
So, was this a capitulation sell-off in one of those big FANG stocks? And that’s a possibility. It’s come back to the moving averages. Got to remember the moving averages are still trending lower, we’re still below the moving averages. But this is potentially part of a basing structure which could see the worst past for Google or it’s actually Alphabet as the official name for it. The worst may have passed at least for now. And if we see stability in some of these big cap stocks, that brings stability to the overall market, and perhaps leadership changes as we move into the next cycle. And we’re looking for the big…the market leaders becoming other stocks, which is something which often happens as you move through market cycles.
Looking at Microsoft, it’s a similar situation. We have this V-shape recovery of what looks like a bit of a spike low. And then looking at Apple is also interesting because whereas Alphabet and Microsoft made new lows recently, Apple didn’t. Apple held its June low and held it comfortably. And there’s also a big support band that’s coming in around here, around about 135 through here for Apple. And it’s interesting we’ve now also got a double bottom support in here at around 133. Strong recovery off those lows.
If we get sideways consolidation, that would be positive because then, again, it sets that launching pad for potentially another thrust upwards. So, overall, I think the stock market picture is looking encouraging at least as far as things go potentially over the…leading into year-end and then early into the new year. The conditions for a big sell-off, they just don’t seem to be there at the moment. It looks like consolidation to upwards seems to be the way that the price action is favoring.
And just coming over and shifting to the…
First of all, if you’re getting some value out of this, please hit that Like button, leave a short comment saying, “Hey, thanks for the video. I understood what you were saying despite your croaky voice.” That would be great. It just tells YouTube that people are watching, and if YouTube thinks people are watching, it shows more people, and that’s why I make the video so I can get the message out to lots of people. And also, hit the subscribe button if you haven’t already, and come and visit me at my website, motiontrader.com.au.
Now, quickly jumping over to the Aussie market before we go to gold. And it’s been positive in the ASX 200 as well. We’re consolidating below this resistance band. We’ve got this big resistance band in around 7200. Consolidation has been really constructive. If I jump to a four-hourly chart, you can see that over the last couple of weeks, we’ve got this flag, flagging pattern has been developing. So, that’s what you have here. You have the sharp run-up, and that’s what that sharp run-up is called the flagpole, effectively, then you got the flag, and then it runs up the other end of the flagpole. So, that’s the theory behind that type of pattern. And it’s interesting to see it setting up now on the ASX 200.
Other thing to note here, though, it’s similar to the Dow in that look where those moving averages are. They’re turning higher, they’re crossing, which is positive, but we’re extended above it. So, it could be a case that maybe the ASX 200 pops out of this pattern, then we could still see some sort of a stall as those moving averages need to catch up or maybe another run higher. But at the moment, the overall price action does look encouraging.
Now I want to go over and have a quick look at gold because gold has been really interesting over the last couple of weeks in that… Well, just a quick recap of the setup. We had this big support band through here at around 1680. We had a break beneath, which wasn’t able to be sustained, and then the sharp rally back above. So, positive sign that there wasn’t follow-through selling after the break of that, what was quite a significant support band. Now the pattern of immediate interest is this downward trend channel that we broke out of. I was speaking about this last week.
And now, I spoke also last week similar to the stock market in that it had run above those moving averages quite quickly and it opened the window for a period of consolidation and some return move perhaps towards the breakout point, maybe not all the way back to it, but some back-and-fill chop before potentially having another run higher.
And we have started to see some sort of a pullback, and I think that pullback could continue to develop. The thing to remember is basing patterns take time, and we’ve had this initial move up, which is encouraging, but we shouldn’t expect that we’re going to see strong price action continuing week in week out. It’s going to be a process, and at least, that’s the way it often is, moving average is starting to turn. I think the potential remains… It’s remaining positive for gold. And I don’t know that now is an asymmetric entry point because I think there’s that possibility that we do get some consolidation before we get another leg up. It’s a case of if you’ve got gold stocks, if you’ve been buying gold stocks that have had some buy signals in gold stocks over recent weeks, I think it’s a case of hanging onto them, and then looking for setups, looking for price action for additional entry points.
And it’s interesting when you look at some of the gold stocks. So, just having a quick look at some of the big ones. So, I look at a stock like Barrick, for instance. And this is interesting because we had this, it looked like maybe Barrick was forming a base from around July, August, September, then we had this sharp thrust lower in early November. So, again, it’s got that look of capitulation about it where we had the sharp move lower. There wasn’t follow-through selling, and we got that snapback straight back, even beyond the breakdown point, right back towards the high of its range over the last few months. Moving averages still haven’t turned higher, but they’re starting to turn. So, again, this could be all part of a big basing formation in some of these large-cap gold stocks. This could consolidate, and that could provide the platform for another leg higher.
Same when you look at a stock like Newmont. Same pattern. Maybe that was the capitulation low. We’ve had the snapback rally. Let’s watch the price action and see if we can consolidate, and then that can provide the setup for the next entry point.
Looking at a mid-tier like Kinross is interesting because, unlike Barrick and Newmont, it didn’t make a new low over the last couple of months. Its July low remains the low, and it’s continued to ratchet higher since moving average or more advanced stage towards crossing and the price is above the moving averages. And you see this across a number of gold stocks. Looking at the Aussie gold stocks you see this setup. That’s something I’ve been speaking about in recent weeks. So, some interesting things happening in these markets.
Please see video for more details analysis and charts
Looking for the best ASX stocks to buy now?
Motion Trader‘s algorithms scan more than 2,000 ASX stocks daily in search of medium term investment trends. We then tell our members precisely when to buy shares. And most importantly, we tell them when to sell.
Try a no obligation FREE 14-day trial of Motion Trader, and see what an algorithmic trading approach could do for you.
Meet Jason

I'm Jason McIntosh, the creator of Motion Trader. My career began in 1991 on the trading floor at Bankers Trust. Nowadays, I trade my own systems from home in Sydney.
Motion Trader is for investors who value robust analysis, data driven entry and exit signals, commentary, and education. I use engineered algorithms to identify when to buy and sell ASX stocks. No biases or guesswork, just data driven signals.