SP500 Set To Break Bears | But Watch For This | Episode 123
Where is the Stock Market Heading?
00:00 Intro
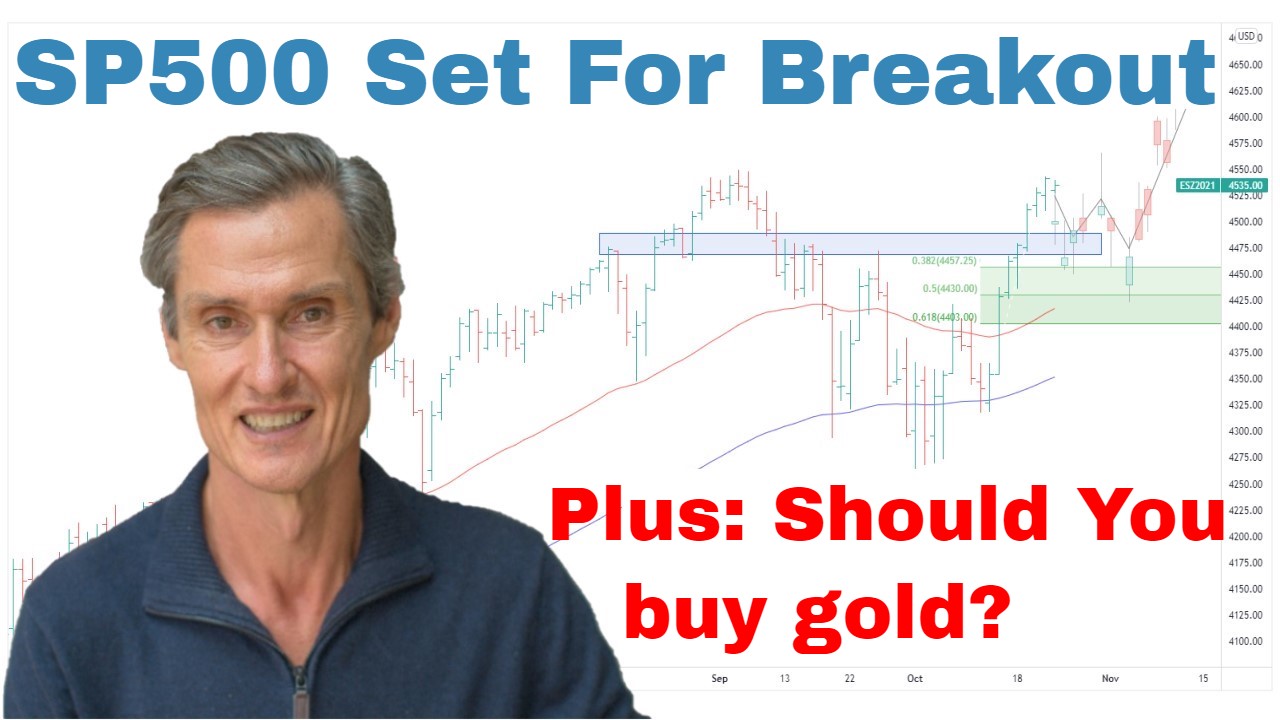
00:30 Can the SP500 break key resistance?
03:37 Smaller stocks remain out of sync (should you be worried?)
05:00 Nasdaq readies for next move (how this fits the puzzle)
06:18 ASX 200 likely to do this next (here’s what I’m doing)
08:08 Why I’m reluctant to add to gold exposure
09:49 Copper setting up for another run
10:12 Is this the time to buy uranium?
Transcript
Please note: Charts available from video
This video is going to focus on the S&P 500. We’ll also have a look at some of the other U.S. indices as well as gold, uranium, and look at the Australian market.
Just one video this week. I’m traveling. I’m on the Gold Coast. I’ve got a day of fun parks and stuff to do, so I’ll keep this fairly short this week. As always, general commentary. It doesn’t take your personal situation into account. All of that said, let’s get into our first chart.
So, we’ve got the S&P 500 up on the screen. And it’s been another constructive week of price action. We can see that since we spoke last week, the market’s really been tracking sideways, and it’s just been sitting below this trend line resistance from this downward-sloping trading range, which I’ve been speaking about over the last several weeks. And I think the fact that the market is pausing here beneath this trend line, it gives extra substance to the trend line. And I think that the longer it sits beneath here, the more important, the more valid a breakout, if indeed we get a breakout, the more valid that breakout will potentially be.
Let’s just quickly jump over to the four-hourly chart. Just have a little bit closer look at the price action. And what we can see here, just over the last week or so, it’s really been a case of the dip being bought. So, we had a strong rally upwards a couple of weeks back. And the price action since then has been…the pullback has been quite shallow and there’s been interest in buying that dip. And the price is also hanging above the 50-period moving average when we’re looking at a 4-hourly chart. So, I think, overall, that’s quite constructive.
Going back to our daily chart, we can see we’ve got the 50 and the 100-day moving averages, price is currently comfortably above those, well above the key resistance at 3900, and then another important area at 3800. They’re not in focus at the moment. The focus point now is what’s going to happen around this resistance point. It’s looking more and more to me like this pause is the launching pad for a test higher, and it looks to me that we should get a breakout at some point.
The other important technical level to keep an eye on is at around 4200. So, let me draw that in on the charts structural resistance, and you can see that picks up this high from back in May, some more technical work through the September period, and you can see some more touch points. So, we’re also beneath there. So, a break of this trend line, a break of this resistance at 4200. I think we’re going to look at that and say that would be very constructive, very positive price action. And from that, I think we’d have to continue to give the benefit of the doubt this market can move higher despite the strong vocal views of those who are bearish on the market that the market has to fall.
So, looking at… So, my position has been remain cautiously long, and that remains the case. I say cautiously because when I go and I look at an equal-weighted S&P 500 ETF, we get a different picture. We get a picture of a market which is really right in the middle of a big trading range which is persistent since going back to June last year. And the market just doesn’t seem to be in sync. It seems to be a case of the big stocks are leading and the smaller stocks are lagging. The best bull markets or the best periods of rising prices happen when the markets are all in sync. Small stocks, mid stocks, large stock, they’re all rising. When it’s just the big stocks pulling the market, it’s usually not a strong setup moving forward. But we’re going to wait and see. This has been constructive so far. There’s been a good bounce off that March low. This market could continue to move higher, but there’s a lot of work to do before we can look at a breakout from this range on the equal-weighted basis. That’s why I say caution.
Just quickly looking at the Russell. And it’s a case of these smaller stocks are lagging even more. They’re below their 50 and 100-day moving averages. They haven’t made much headway since the low on March. This could still be a basing pattern, but there’s a lot of work to be done before we can be looking at a breakout higher in the Russell. Then again, contrast that with the NASDAQ 100. And this looks like, again, a shallow consolidation before another push higher.
So, this will all become clear in hindsight why the markets are behaving the way they are. All we can do at the moment is look at the price action and try and put all these pieces together. We have a disconnect in the market where we have big stocks leading, mid to small stocks lagging. And how this plays out, time will tell. But at the moment, it’s a case that we do have upward momentum in those larger stocks, in those big indices. So, I think it’s a case of continuing to run with that theme of being conservatively long the market. That’s the way I’ve been playing this and the way I continue to do so.
Now, I’ll have a look at gold and copper in a moment. But first of all, if you’re getting some value from this, please hit that like button. Please leave a short comment, just “Hey, thanks for the video.” It just tells YouTube you’re watching and YouTube shows more people. And hit that subscribe button if you haven’t already done so, and come and visit me at motiontrader.com.au and see if the stuff I’m doing there might be able to help with your portfolio, particularly if you’re interested in ASX stocks.
Speaking of ASX, let’s have a quick look at that before we get to gold. Another good week. A good week for the ASX 200. I thought last week we were ready for more of a pause. I thought the market may have needed to do a little bit of work, much like what we’ve seen in the S&P 500 over the last week, but that hasn’t been the case. The market had another kick-high during the week. I still think a pause is coming. This has been a big run from the March low through to the recent high. We’ve crossed from below the moving average to above the moving averages. This has been the 50 and the 100-day as I usually have on.
And often when a market goes from below to above, there’s often some sort of a pause, some sort of a pullback. And that’s what I think is coming. I think it’s not an asymmetric entry point at current levels. Again, we’re approaching this big overhead resistance, triple top resistance at around 7600. But again, it’s a case of stick with what’s working. If there are stocks in your portfolio which are trending upwards, I’d see no reason to be exiting those positions. That’s what I’m doing with my portfolio. I’m keeping the stocks which are rising, and I’ve used this bounce to exit some of the positions which had been lagging. A bounce has helped exit some of those weaker positions which I needed to rotate out of to look for new opportunities which are trending, and I’ll continue to do that.
Small Ordinaries, not dissimilar to the Russell, big range. Being better than the Russell in that this has been a stronger bounce off the low. We’re now getting towards the upper half of the range. So, again, a case of keep what’s working, exit what’s not.
Now let’s get to those commodities. Gold. A really good week, really positive week in gold. For the last two weeks, I’ve been saying I thought this market would pause and have more of a pullback towards these moving averages, but relentlessly, it keeps moving higher. So, the play with gold has been to hold. For me, it’s been keeping the gold stocks in my portfolio. I’ve been reluctant to add the gold positions with the market having had such a big run off these moving averages and being stretched above the moving averages and also closing in on resistance. So, that remains the case for me. It just doesn’t appear like an asymmetric entry point. That said, as I’ve been saying, it’s keep what’s working. It’s not about trying to take profit and trying to be tricky and buy back in at lower prices. If the market’s trending, if positions are working, there’s really no cause to do anything but let them run. And if they pull back, that’s all fine. That’s all part of the process of how all this works. But I’m just not keen on buying up here.
I also had a look at a rate-of-change indicator. And when we look at that, you can see the rate of change has really been declining over the last couple of weeks. So, while the gold price has been making new highs, the rate of change has been coming down off an elevated level. Now that doesn’t necessarily mean there’s going to be a big pullback, but it does mean there could be some pause, another reason I think for caution towards adding to gold positions.
Just quickly, I was going to have a look at copper. Copper’s been looking good. It’s been behaving well. We did get a breakdown in March, but it was short-lived, a break below this support at around $4, briefly below the moving averages, but since then, it’s snapped back, has been holding support, and now looks to be breaking higher. So, there seems to be a broad theme across commodities generally.
Uranium’s the one which I think a lot of people are really interested in. I’m certainly interested in this. Currently below these moving averages, which is… For me, when it’s below the moving averages, it’s not the time to buy. We’re still stuck in this range, in the middle of the range. I think we want to see these recent lows in uranium hold. That’s the case. And uranium can then push back above these moving averages. Well, then it opens up another possibility for another run at this overhead resistance at the top of this big range that Uranium’s been in since…you go back to September 2021, effectively been in a big sideways range.
And Cameco is the stock we’ve been watching again in this big range. These ranges break, and when these ranges break, they typically lead to large moves. But I don’t like preempting breaks because breaks can come in the opposite direction of what you think they should break in. So, it’s possible this could break to the downside. I continue to think the break will come to the top side, but I don’t really want to do too much adding to my uranium positions until we get those breaks. But it’s just watch, be patient. The breaks are going to come, and it could set up a terrific play later on as we move further into the year.
So, with all of that said, let’s leave it there for this week. And thank you for joining me for this video covering everything, one video this week, and yeah, I look forward to seeing you again next week. Until then, bye for now.
Please see video for more detailed analysis and charts
Looking for the best ASX stocks to buy now?
Motion Trader‘s algorithms scan more than 2,000 ASX stocks daily in search of medium term investment trends. We then tell our members precisely when to buy shares. And most importantly, we tell them when to sell.
Try a no obligation FREE 14-day trial of Motion Trader, and see what an algorithmic trading approach could do for you.
Meet Jason

I'm Jason McIntosh, the creator of Motion Trader. My career began in 1991 on the trading floor at Bankers Trust. Nowadays, I trade my own systems from home in Sydney.
Motion Trader is for investors who value robust analysis, data driven entry and exit signals, commentary, and education. I use engineered algorithms to identify when to buy and sell ASX stocks. No biases or guesswork, just data driven signals.