SP500 set for HIGH Velocity Break | Episode 48
By Jason McIntosh | Published 8 July 2022
Trade the Trend is a weekly video focusing on where the stock market is going. It’s for investors and traders looking for insights to the market’s next move. Jason uses technical analysis of stocks and trend following techniques to help you piece together the world’s biggest puzzle.
Where is the Stock Market Going?
00:00 Intro
00:29 SP500 could be set to rally (quick summary)
01:32 Amazing graph: The worse stock market sentiment in 29 years!
02:30 But be aware of this bearish scenario for SP500 (quick summary)
03:01 The bullish SP500 case, and the technical pattern to watch
06:14 Key technical levels for the SP500
09:14 Why you should still be playing defence in the stock market
12:58 This has only happened 13 times since 1962 (look what happens after!)
Transcript (abridged)
Please note: Charts available from video
Let’s start with where the S&P 500 could be heading. It’s been a relatively quiet week following some big days in recent weeks. We’re really waiting now to see which way the next big shift in momentum is going to be.
There are a couple of possibilities at play that I want to go through. The first one is that the market is now stabilizing, and everyone who wants to sell has now sold, and that potentially sets the market up for a corrective rebound to the upside. There’s just so much negative sentiment at the moment that it does potentially set the stage for a meaningful rally.
Take a look at this graph from a group called Bespoke (see video). It shows how bad sentiment currently is. They’ve calculated the number of consecutive weeks that bullish sentiment from the American Association of Individual Investors has been below 25%. We’ve just had five weeks in a row where bullish sentiment from the survey has been below 25%. You have to go back 29 years to 1993 to find a similar period where sentiment has been so bad.
The other possibility that could be taking shape is that the S&P 500 is potentially establishing a new ledge from which to fall off. And that sort of scenario still remains on the table. There’s nothing in this price action to rule out that another sharp decline is coming over the next few weeks.
Let’s start with the bullish case…
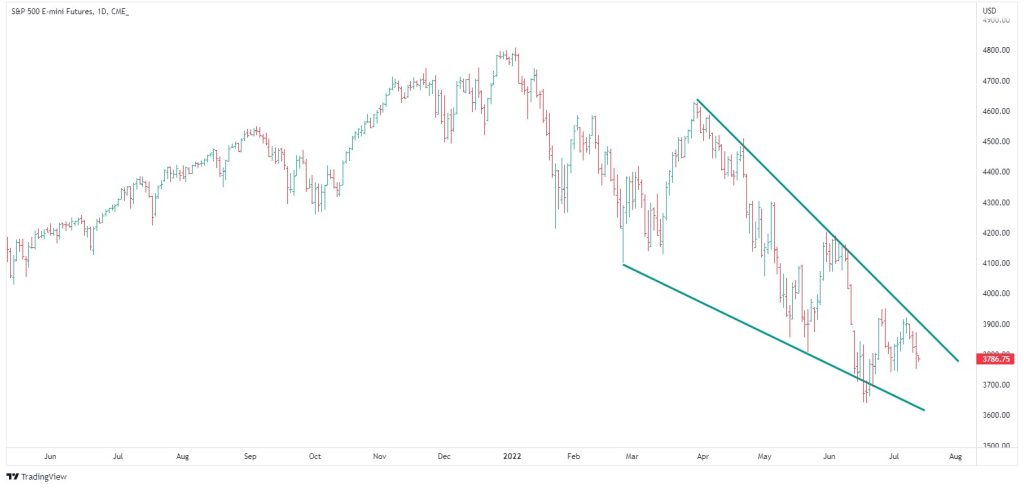
There’s a potential bullish wedge formation that’s been developing since the February low. It’s not perfect, as it dips below the lower support line of the pattern. But we still have that general wedging shape.
It’s also interesting to look at this June low. It’s possible that was a failed break lower. The S&P 500 broke below the May low. The market initially declined and then snapped back. So it’s possible we could call this a failed break.
And if that were the case, it could be an exhaustion low, where all those wanting to sell sold, have now sold. It’s interesting to look at an advance-decline line (see video). Because what we have on the advance-decline line is some divergence. When the market made a new low in June, the advance-decline line didn’t confirm with its own new low.
What I’d like to see now is for the advance-decline line to make a new high. If it does that, it will give some substance to the possibility that this is a bullish wedge. A break to the top side could then break the sell cycle which has been in place for several months. It would also break the sequence of lower lows and lower highs.
So, what needs to happen to activate that scenario?
Let’s start by looking at a four-hourly chart:
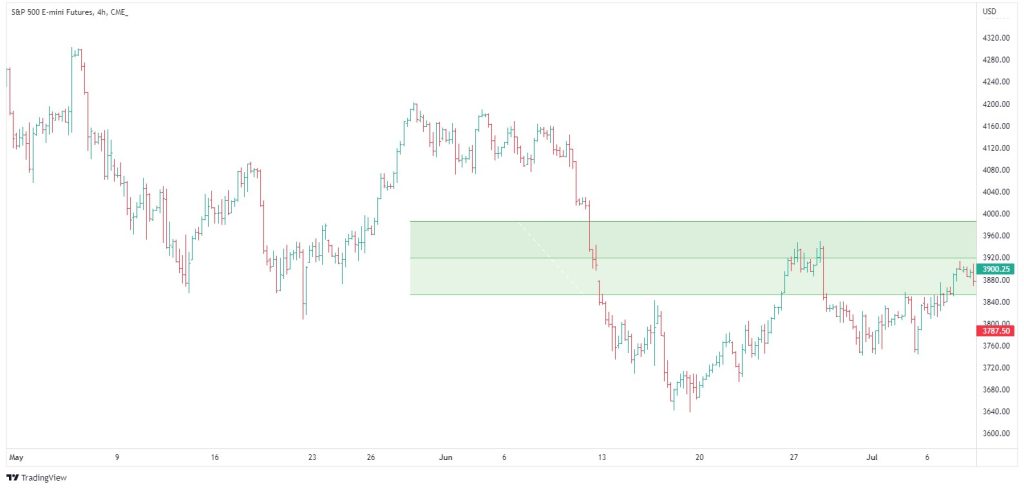
I want to focus in on this last leg of the decline. You’ll see the Fibonacci retracements. The rally off the June low came right up into this Fibonacci region, just above the 50%, then it started to back off. The Fibonacci region rejected the rally and the market S&P 500 fallen away. It’s now attempting to rally again and retesting that area.
I think the key to the rally scenario is around 4,000. If you look at around this region, you’ll see the top of the Fibonacci band. We’ve also got the upper band of the wedge pattern, and the high point from June. It all comes in around 4,000. If the S&P 500 can work its way above these points here, then it opens the possibility of short-covering and for momentum to build upon itself.
So, what could go wrong?
The important point to note is that bullish wedges don’t always break to the upside. Sometimes they fall out the bottom and accelerate lower. And that would fit in with that cascading scenario that I’ve been speaking about over the last couple of weeks. If you’ve been watching, I’ve been talking about a cascading setup where the rallies get shorter, and the declines get sharper. And we’re at that point now where if we get that really sharp capitulation selloff, this would be the natural place for it to occur from. So that’s what we need to be aware of. That risk is still on the table.
I’m going to give you some levels to look out for. These will help you know if the bullish or bearish scenario is starting to engage. On the upside, 4,000 is a key point. If the market breaks 4,000, the momentum starts to shift higher.
On the downside, the level to watch is 3,700 (see video for analysis). If that gives way, I believe the market goes on red alert for an accelerated decline. And I’ve got to tell you, really, I’m finding this a very difficult market to call right here. I think both scenarios have merit, and I wouldn’t be surprised either way, whether we get an up-market over the next couple of weeks or we get a sharp selloff.
And I had a guy leave a comment a couple of weeks back, and he sarcastically said, “This is brilliant. You’ve identified the market could go up or it could go down.” And in one respect, he’s right because that is what I do tend to say most weeks. I give possibilities. And I do that because I don’t know where the market is going to go. Nobody does, and if anyone tells you they do know where the market is going to go, well, they’re really not being serious and they’re not being fair to you. They’re giving you misguided hope into whatever they’re saying.
My job is to identify possibilities, and then to help you understand the likelihood of them playing out. And while I don’t have a crystal ball, hopefully, I can provide you with a framework that at least helps you navigate what are highly uncertain markets.
With so much bearish sentiment out there, it can be tempting to try and pick a low point. I’m hearing people are trying to do that at the moment. They’re saying, “There’s so much negativity. Things have got to go up. They can’t get any worse.”
But I think our base case has to be that while the market remains below the 50 and 100-day moving averages, and whilst that’s the case, the trend is still down. We need to respect the risk that the market deteriorates further. I think the name of the game remains defence… not taking undue risk, not trying to call the lows. We’ve got to let the price action tell us when the time is right to really get positive about the market.
But there are some interesting things to keep an eye on over the next couple of weeks. So you know those levels. We’re watching 4,000, we’re watching 3,700, and we’ll see what the market brings us.
Please see video for more detailed analysis and charts
Looking for the best ASX stocks to buy now?
Motion Trader‘s algorithms scan more than 2,000 ASX stocks daily in search of medium term investment trends. We then tell our members precisely when to buy shares. And most importantly, we tell them when to sell.
Try a no obligation FREE 14-day trial of Motion Trader, and see what an algorithmic trading approach could do for you.
Meet Jason

I'm Jason McIntosh, the creator of Motion Trader. My career began in 1991 on the trading floor at Bankers Trust. Nowadays, I trade my own systems from home in Sydney.
Motion Trader is for investors who value robust analysis, data driven entry and exit signals, commentary, and education. I use engineered algorithms to identify when to buy and sell ASX stocks. No biases or guesswork, just data driven signals.