SP500 Ready to Fall Again | Gold and Copper | Episode 97
Where is the Stock Market Heading?
00:00 Intro (can you guess where I am?)
01:00 SP500 has two key technical risk
03:58 Dow following the script (what next?)
04:36 Look what pattern is forming on the Nasdaq
06:30 Avoid stocks like this
08:42 This is the situation in ASX 200 and Small Ords
09:37 The latest on gold, silver, copper and platinum (plus an ETF for platinum)
Transcript
Please note: Charts available from video
This is a special holiday edition, so I’m going to be covering a few markets in one video this week. I’m going to start with the U.S. markets – SP500 and Dow Jones. That’s going to be the main focus. I’m going to look at the ASX200, the Australian market, as well as some of the precious metals – gold and silver. As well as a quick look at copper, so make sure you stick around for all that. As always, this is general commentary. It doesn’t take your personal situation into account.
Now you probably noticed a different backdrop to usual. Well, I’m on the annual family road trip, and at the moment, we’re at the Mount Panorama Racetrack in Bathurst, New South Wales, about three hours out of Sydney. Fantastic place to come to. And we’ve done a few laps of the circuit already. We’ll probably do a few more. Kids love it. I love it. Motorsport. A lot of fun. Anyway, enough said with all that, let’s get into these markets, and see what is going on as we head into the end of the year.
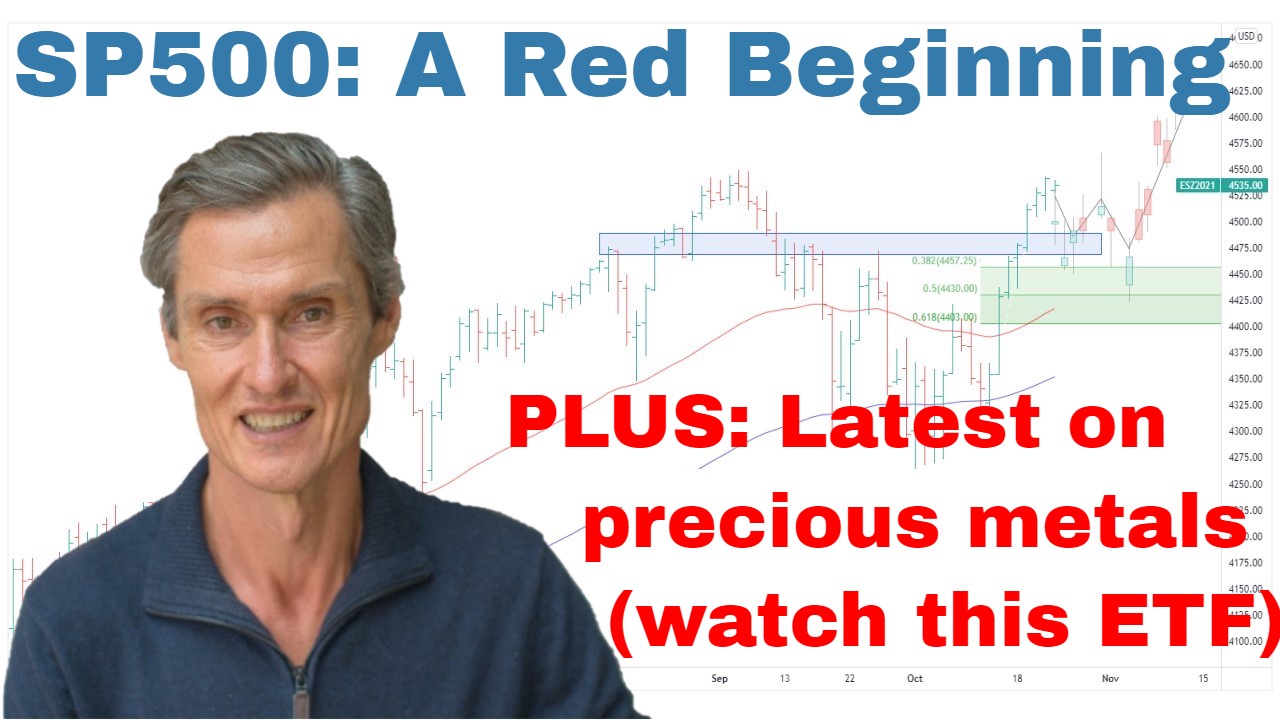
So, S&P 500. Well, it’s been a quiet week, but it’s also been an interesting week. Just zooming in on the price action. And I’ve got to say it does remain vulnerable. It remains vulnerable, while it’s sitting below this resistance region. We’ve talked about this for months now, this resistance region, going back to May. It’s oscillated between support and resistance. It’s now resistance with the market below. Market is also below these moving averages. Looking at the 50 and the 100 days. Whilst the market is below moving averages, you need to be wary. You need to be wary that a market could then accelerate to the downside, and for the losses to increase. So, we need to be wary while the market is below those moving averages.
I just want to jump over to the four-hourly chart for a moment. Just have a little closer look at some of this price action. And when we just look at it, over the last few days, we can see we’ve got a bit of a contracting triangle trading range that we called a triangle just sitting in around here. And now a triangle is often what we call a continuation pattern. So, you’ll have a move into the triangle, you’ll have the consolidation, and then the pattern will continue the previous trend, which in this case would be to the downside.
So, it’s really interesting, and it’s really important to watch this price action over the next few days. Are we going to see something like this develop where it does break to the downside, and we do test these lower levels, which is something we were talking about last week and remains the…? I would say this probably remains the most likely scenario at this point. Or alternatively, does the triangle break to the top side, and we start to retest this downward trend line a little bit sooner? A bit early to say. We need to see what the price action delivers.
Just going back to this daily chart. I think we do need to be wary that this market may test lower. And this is the scenario that I was talking about in last week’s video. Go back and have a look at that to refresh on what we were going through there. Doesn’t necessarily mean the market is going to a tailspin, and we’re going to retest these lows further, but it does mean we may see… I think we may see some lower levels before we see a potential for the market to try and turn again. But we need to wait and see. And you just need to watch that price action over the next few days.
And just looking at the Dow. Quickly coming over to there. And that’s continued to consolidate along these moving averages. Putting on the Fibonacci retracements, and you can see markets come back to the 38.2%. Wouldn’t be at all unusual for this to continue to pull back close to maybe the 50%, or maybe we can get some sort of basing pattern and another test higher. That remains my preferred case. Again, it goes back to that analysis and those possibilities that we were talking about in the last week’s video. Check them out if you’re not sure what they are.
And one of the really interesting ones to keep an eye on is this NASDAQ. So, the NASDAQ’s been the weakest of these U.S. indices. What you’ll see here, you’ll see these two green downward-sloping converging trend lines. Now, that’s potentially a bullish wedge formation. This would be the most positive outcome for the market in the near term, maybe over the next couple of months if this were to develop into this bullish wedge formation. And what we’d be looking for is maybe we do see a bit more test to the downside as I’ve been talking about in the S&P 500, and in the Dow. Retest those lows that we had from a couple of months ago.
And this is where it gets interesting. If the market can’t break below those lows decisively, and then we start to see some sort of a rebound, maybe it’s some short covering, I don’t know what the catalyst would be, but if the market can’t accelerate below those previous lows on a retest, it does open the potential for this bullish wedge to really come into play. That’s the type of price action you’d get from a bullish wedge.
I know there’s a lot of bearishness out there at the moment. There’s a lot of concern that the market is going to collapse, but we need to look at the price action. We need to look at it objectively, and we need to look at what the possibilities are. Yes, a collapse is possible, but there are other scenarios which could play out as well. The weight of sentiment that the market is going to collapse makes me wonder whether we do see this heading into January, February, whether we do see a rebound, not necessarily a new bull market, but some rebound to counter the quite extreme negativity and fear, which I think is out there at the moment.
But one thing I think we need to be really wary of is avoiding stocks that are below their moving averages. And Tesla is, yes, an incredible one to look at how this is rated over the last couple of months. So, first got down below these moving averages back in late September, and it’s really started to unravel. It’s down over 70% from its highs going back to just over 12 months ago, down over 70% in about a year, and just in the last couple of months. So, just from going back two months ago, the market was below the moving averages. So, as I keep saying, that’s the point of vulnerability where you need to take the most care. And look what it’s done. It’s fallen 50% in two months.
I think it’s really important at this point in the market to be careful and wary of stocks below these moving averages. I think it’s risky to try and pick lows. I think it’s a case of staying clear of anything below the moving averages because they’re the ones which can potentially really come apart in a big way. We’re looking for opportunities where stocks are above the moving averages, have some positive upward momentum, and we’re finding those in the commodity plays at the moment. That’s where we’re seeing that set up predominantly, and also in some of the industrials, but we’re not seeing it too much in the tech side, hence the NASDAQ being as weak as it currently has been.
Now, if you’re getting some value from this, please hit that like button. Please leave a short comment, just, “Hey, Jason, thanks for the videos.” It just tells YouTube that people are watching, people are engaging, they show more people. That’s why I’m making these videos. And so, please do that. It helps me so much. And hit the subscribe button if you haven’t already done so, and if you’re interested in the stock market, come over to my website at motiontrader.com.au and see the stuff that I’m doing.
All right. Let’s go to the ASX before we move to commodities. And actually, so I’m just going to scroll down to my ASX page. Jumped over to gold, and touched quickly there. So, here’s the ASX 200. So, ASX 200 has continued to pull back towards these Fibonaccis, back to the 38.2%, back to the moving averages. It continues to look corrective to this big rally we had from the October lows. I think it’s a case of just continue to watch how this price action plays out. I’m staying a long stocks which are above the moving averages. I’m exiting ones which are losing their momentum and starting to move below the moving averages.
Just quickly looking at the ASX small ordinaries. It’s pulled back. It’s below the moving averages, so it’s time to be a little bit wary, but it is sitting on support, which is positive. So, let’s just watch how this price action plays out over the next couple of weeks as we move into the New Year.
So, now just moving over to some of these commodities, looking at gold. And gold continues to move. It’s grinding higher. I can’t draw in a bearish wedge formation. I was looking at that. I was looking at this and saying, “This is like wedging or bearish wedge formation, which would potentially see it pull back towards these moving averages. But there isn’t a clear pattern there, but it does look like the momentum is going to wane, somewhat. And I like the overall structure, but I do wonder whether it is going to have a pullback retest these moving averages before then potentially pushing higher into the New Year.
Overall structure looks good. It’s just whether there’s still going to be this pause. We have been getting a pause, but we haven’t been getting the pullback, so we’ve got half of the consolidation. We’ve got the move sideways, but we haven’t got the pullback towards the moving averages. I think that could still be to come.
Same applies when I look at silver. Just in the last couple of weeks, it does seem to be struggling to push higher, but the moving average is a positive. I think it’s a case if you’ve got positions in precious metals, I’d want to be holding those positions. It’s just a case of where do you add more, or where do you enter if you’re not already in? And the risk with getting in an elevated level above the moving averages is that we do get some sort of a shakeout, and precious metals are notorious for that. They’re notorious for their shakeout. So, it’s just being a little bit careful around how to add extra stock to our current positions. I think the key to this really is what the U.S. Dollar Index does.
Just looking at the Dollar Index below these moving averages. So, as I’ve been saying, that’s when a market is vulnerable. For the last few weeks, it’s looked like it was oversold, and it wanted to go back and retest these averages, but it hasn’t happened. So, it does always has that potential below the moving averages to accelerate to the downside, which would then likely see those precious metals rally quite strongly. I think it’s just a case of hold the positions where the momentum’s positive, but be wary that we could have some sort of a pullback if the dollar does correct back towards the moving averages. But the path of least resistance overall at this point remains to the downside.
And just quickly have a look at copper, well, because that continues to trade. I think the setup here continues to look good. The market continues to coil between these two support and resistance. So, we have support down here at around 3.60, resistance up here at around 4. And it’s going to be a case of which way it breaks. I’m favoring it’s going to break to the upside, price is above the moving averages. Moving averages are crossing into higher. I think copper is starting to look good. And the copper play, which I was talking about last week, is the ETF COPX trades on the U.S. Exchange, or W-I-R-E trading on the ASX I think is an interesting way to play the copper market.
And just one last market I want to bring to your attention, platinum. Platinum, really interesting price action just last night, just broken out of this trading range. Just sketch it in here. A bit of a triangle-type range. Coiled up. A little bit like copper is doing now, broken to this top side, moving averages have crossed, price is above the moving averages. This is what I’m thinking with gold, this same…will it pull back and consolidate back to the moving averages before pushing higher? That’s what I’m thinking is a possibility. But we’re seeing this breakout in platinum.
Now, if you’re wondering how you play platinum, not that many pure platinum plays, which are easily accessible. One way to play the platinum market is through an ETF. You can get these on the U.S. Exchange. It’s an ETF that plays on the platinum price itself, not the individual stocks, not the individual platinum producers, but if you like the idea of playing a breakout in a commodity, which has been in a large decline for almost a couple of years now, [inaudible 00:14:10] that breakout. Does look interesting. The way to play it could be through an ETF like PLTM trades on the U.S. Exchange.
So, anyway, let’s leave it there. Let’s leave it there. Let’s call that a wrap for 2022. Thank you for joining me this year. It’s been terrific to have you with the channel, help me grow the channel through the years. I’ve seen a terrific increase in subscriber numbers since this time last year, and a lot of that is due to support, people like yourself. Thanks for watching through all the way to the end. So, I know you are the true viewers who watch all the way to the end. And it’s been fantastic talking to you. I look forward to talking to you next year. Hopefully, what I do is helpful to you. Hopefully, I can help you find some new ideas as we go into the New Year. I’ll get back to watching classic cars go around the racetrack. So, have a good new year. See you next week. Until then, bye for now.
Please see video for more details analysis and charts
Looking for the best ASX stocks to buy now?
Motion Trader‘s algorithms scan more than 2,000 ASX stocks daily in search of medium term investment trends. We then tell our members precisely when to buy shares. And most importantly, we tell them when to sell.
Try a no obligation FREE 14-day trial of Motion Trader, and see what an algorithmic trading approach could do for you.
Meet Jason

I'm Jason McIntosh, the creator of Motion Trader. My career began in 1991 on the trading floor at Bankers Trust. Nowadays, I trade my own systems from home in Sydney.
Motion Trader is for investors who value robust analysis, data driven entry and exit signals, commentary, and education. I use engineered algorithms to identify when to buy and sell ASX stocks. No biases or guesswork, just data driven signals.