SP500 Ready For Big Move | Episode 113
Where is the Stock Market Heading?
00:00 Intro
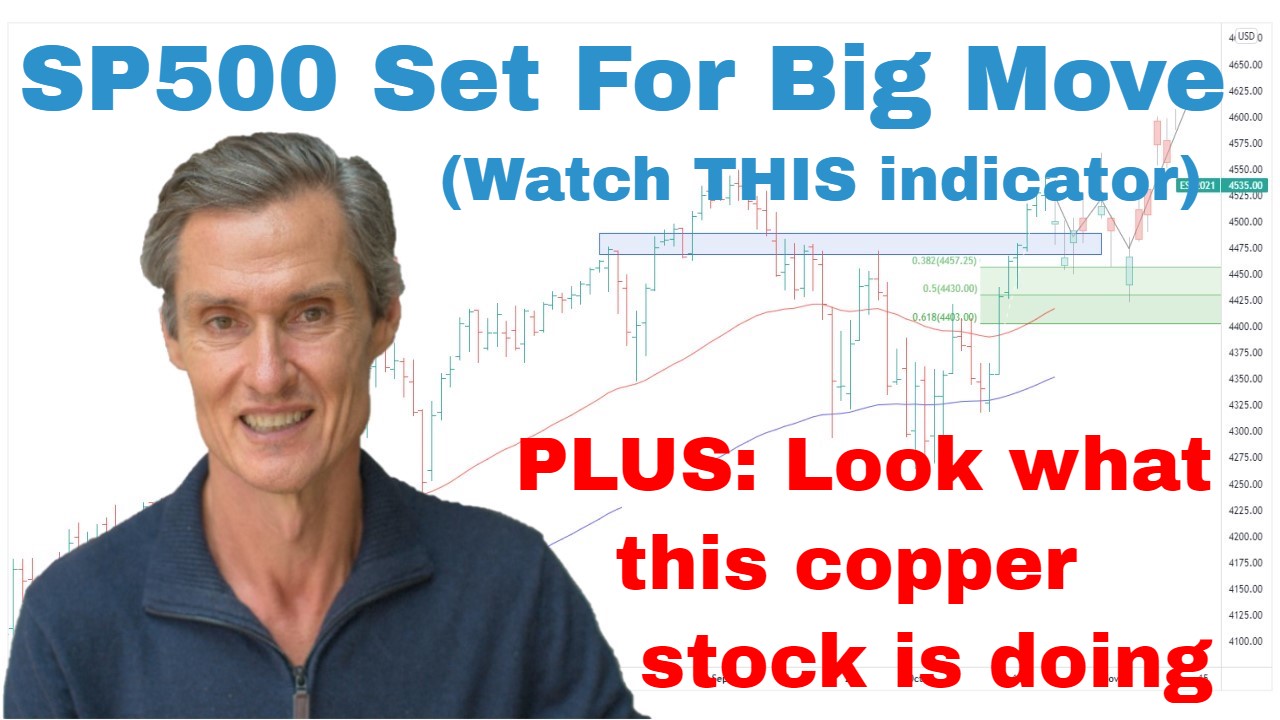
00:30 SP500 delicately poised (this area is key)
06:34 This is a clue to what will happen next
08:44 You won’t believe this comment after a recent video
13:27 Look at what the Dow just did (this is important)
15:12 A big lesson in the ASX 200 (don’t miss this!)
17:33 Copper setting up for the next move
19:33 Keep an eye on this copper stock
Transcript
Please note: Charts available from video
This video is going to focus on the ASX 200. I’m also going to have a look at the Dow, the ASX 200, and copper. So, make sure you stick around for that. Just one video this week because I’m going to be traveling after recording this one, so I don’t have the usual second video. As always, this is general commentary. It doesn’t take your personal situation into account. All right. With all that said, let’s get into our first chart.
So, we have the S&P 500 up on the screen. And this is really a delicately poised situation. It’s also I think quite a difficult time to be analyzing these markets because there really is a potential for the markets to move in either direction. This is one of those pivotal times where you can see a clear pathway in either direction. What we’ve had is we’ve had this really good momentum from the October low. It’s carried us through for the last, what, four or so months now. But there are signs that it is starting to potentially stall, and that’s been taking place over the last probably three or four weeks now.
And the S&P 500 has come right back to a key support region. So, I just want to go through this support region, just outline where the important areas are. And it really is a technically active region. So, we can start with this blue-shaded area which is support resistance area at around 3900. So, this goes all the way back to May ’22. So, it has a long history of providing support as the market has come down and then providing resistance as the market is trying to rally.
Now here we are. Market has pulled back. S&P 500 has pulled right back to this region and is testing it now. We’ve also got the moving averages coming through. So, I’m looking at the 50 and the 100-day moving averages. The S&P has come right back. It’s actually a little bit below the moving averages. So, at this point, I’m not overly concerned with the dip below the averages because the averages are still positive in that the 50-day is above the 100-day. But it’s not a situation I want to see persist for too long, having price below moving averages.
And the other point to make is that we are right back at this breakout point above this trend line that dates back to January ’22. Big deal when it broke out above there in January, and now we’re retesting around the breakout point. Not an unusual thing to have a market retest where it’s broken out from, but again I wouldn’t want to see it deteriorate too much further from current levels.
And lastly, we can put some Fibonacci retracements on. So, I’m going to use the December low and the February high. When you do that, just looking at this green-shaded area, you can see we’re right down at the bottom of the Fibonacci retracement region at the moment. So, from that perspective, I think the bullish case that I’ve been speaking about for several months, I think that we’re at one of those times where it’s really been tested. It is currently being tested. There’s no doubt about that. I think we could say that so far, this pullback from the February high, it’s still within the tolerances of what we can call a pullback, but I think it really does need to start to hold the line here and now. It really is an important point.
Now I want to jump over just briefly to an hourly chart because this was interesting Thursday’s price action. Now I’m filming this on Friday morning in Sydney. So, of course, I don’t have Friday’s price action for the U.S., but it is interesting to look at Thursday’s price action in that… I was actually watching this breakdown in the overnight session on Wednesday in the U.S. That was during Thursday Australian time. I was watching this breakdown. What was interesting in the day session on Thursday is that we saw this strong rally develop from the lows. Now, this is important in that… So, what was this rally? Was this just short covering? Was it short covering from traders who have been selling these breakdowns over the last few days and just had a short covering rally? Something like what we saw a week or so ago, a quick rally and then a fall, quick rallies giving ways.
Ideally, what we’re seeing is something more like what we saw in mid-January where we did get that sharp rally start to develop like we’re getting now. What we need to see now is we need to see the follow-through. So, it’s going to be interesting what happens in the day session on Friday. Do we potentially have a quiet day and then follow-through next week or follow-through tonight? Let’s just wait and see. But this is a key moment for the bullish case. Is there going to be buy the dip? And this is where the dip really does need to be supported and need to be bought.
And I think the other point to make is if we do get a breakdown in the next few days that takes us below this support, the point I want to make here is it doesn’t necessarily mean the market is then going to spiral down and quickly start applying to new lows. Yes, that thing could happen, but I don’t think it would be a foregone conclusion. What we’d want to see if we do get a breakdown, we want to see what that breakdown looks like. Is there follow-through selling? What do the rallies look like? And we assess the price action as it comes. There’s too many unknowns at the moment to be calling for new lows. As I know, I know a lot of the bears are. They’re calling this is just a bear market rally. We’re heading for new lows. Maybe that’s the case. But at this stage, the evidence isn’t there to support that proposition.
Now what I want to quickly do, I’m going to throw on an indicator. We had a quick look at this last week. It’s the advanced decline line. Now, this is really interesting to me, and this is a clue that maybe this support region’s going to hold. Now this low in the advanced decline line was on the 21st of February. Look at the S&P on the 21st of February. It’s had several new lows since then. Advanced decline line hasn’t been having those lows. It’s had a brief rally, and it’s been tracking sideways. So, we had what you’d call some bullish divergence. Now, this could quickly give way. It just takes a dip below this low point on 21st of Feb and the divergence is gone. But as it stands, the advanced decline line has been holding despite the S&P 500 giving ground. So, that’s a mild positive.
Interesting to look at some of these previous periods when the market has turned lower. Let’s have a quick look at these. So, look how quickly the advanced decline line fell away at some of these previous peaks. It was really quite a rapid decline. And now look what it’s doing. Look what it’s doing now. It’s not a rapid decline. Look at the difference in the gradient of these lines. It’s also similar to this period here where… Just look at the gradient. It’s quite similar in that it wasn’t a sharp fall away. It was more of a grind sideways to slightly lower. This was, of course, the November consolidation which led to higher prices. So, maybe this support will hold and maybe we are going to have a rebound off there and potentially a retest of 4200 in the weeks ahead. A lot of unknowns with this still. We’ve just got to keep watching it and seeing what happens at this support area.
And if you’ve been following these videos, you’ll know that I’ve had a mostly positive outlook since mid-October when we had this breakdown. There wasn’t follow-through selling. The market snapped back. For me, that was a sign that we were going to test the upside, and it was a case of let’s see where that upside goes. So, I’ve been long stocks. I’ve been long the S&P 500. I have had a good portion of cash as well. It’s been a cautious approach of riding the momentum, but it has been a case of riding the momentum.
Now, really interesting. I got a comment at the bottom of my…after my YouTube videos a couple of weeks ago. And a guy said, “Hey, you are just saying the market is going to go up because you are long the market. As they say in the industry, you are talking your book.” And that’s what we’d say when someone’s got a bullish view and they’ve got a bullish view simply because that’s what they’re holding. That’s how they’re positioned. And it made me think, it made me step back and think that, “Am I speaking bullishly?” Because that’s the way I’m positioned. I think it’s a really important thing that we always should do. We’ve got to ask ourselves, are we looking at data objectively, or are we being blinded by what we want to happen? And when I step back and I do that and I go through that process, for me, it has been a case of riding the momentum and then using risk management should that momentum fail. So, I’m still long the S&P 500 as I have been since mid-October. And having said that, though, I’m under no illusions to the risk. And this is the difference between someone who’s just blindly optimistic and someone who’s assessing risk in that should this market break down, I won’t hesitate to cut my position and move to a more neutral stance.
And it’s interesting I think about how I would have handled this situation back earlier in my career. So, I spent most of the 1990s working at a leading global investment bank. And I had a desire to short the market quite a bit during that period. There was a lot of volatility. There was a lot of bearish scenarios. And I think of how I would have traded that period or how I would have traded this period as my younger self. I would have been short the market in October as it broke to new lows. I would have been stopped out as the market rallied. I would have got short again in November as the market started to roll over because I would have been calling this a bear market rally and I would have been looking for another break to new lows. Again, I would have been stopped out. I would have been short in December.
And this is like a lot of my colleagues who I’d be with. This is how we would trade, and this is how a lot of people do trade. I would have been short in December on this breakdown looking for follow-through selling. And sometimes I would get those big follow-through moves and make some good money. But the point is I wouldn’t have been objectively looking at this upward momentum thinking, “Could this momentum assist?” And I’d be looking to be short currently.
And this is the thing. At this point, it’s a nerve-racking time to be holding a long position with so many people calling for bearish scenarios. The macroenvironment looks bleak still and a lot of people are calling for new lows. It can be hard to be long. It can feel good to be either in cash completely or short the market. But what I can tell you from many years of doing this and seeing myself trade, seeing others trade, what feels right is often wrong. So, sometimes it’s the least comfortable positioning which turns out to be the best. That’s not to say the market has to rally now but keep an open mind. We are above support. It’s too early to say this market has broken down because it currently hasn’t. It is holding support at the moment. If that changes, the view changes. But at the moment, the market is holding support.
Now, if you’re getting some value from this, please hit that like button. Please leave a short comment, just “Hey, thanks for the video.” It just tells YouTube people are watching, and YouTube shows more people, and that helps me so much. So, please do that. And also, hit that subscribe button if you haven’t already.
Now, just briefly, I’m going to look at the Dow. Looked at the Dow a few times in recent weeks. It’s come right back to the Fibonacci retracement. So, I’m using the October low, I’m using the December high, and we’re right back here at the Fibonacci. Not surprising. I spoke about this possibility a few weeks ago when we were testing this big resistance band up at around 34,000. I said a retest of the Fibs wouldn’t be out of the ordinary. And it gives us that classic zigzag. We’ve got the classic zigzag move in place where the market… You get A, B, C or the zigzag sideways move lower. And the psychology around this second test lower is often that the markets are now breaking down. This is going to follow through. It’s going to go a lot lower. It seems to be the way a lot of people are thinking now and that could happen.
But at the moment, when I look at this overall situation from the October low through to where we are now, as it stands this is an impulsive rally. This is a sideways corrective move. It’s not a breakdown. So, I think at this point, we need to see whether the support holds. I am watching these moving averages closely, the 50 and 100-day. At the moment, they’re starting to roll over. Should they continue to roll and cross, and if the Dow is below it, well, that starts to change the situation. But at this point, I’m going to give that the benefit of the doubt, see if we can get a rally off this support.
Now, I want to just move briefly across to the Australian market. And this is really a good example of why we need to be aware of technical levels. I think technical levels are important. Even if you’re a fundamental guy, being aware of technical levels is important. Big triple top resistance at 7600. And so this has been a key level to be aware of. And as ASX 200 started to approach this resistance in, when was it, late January, early February, it was just not an asymmetric time to be putting on new positions, to be putting on ASX 200 risk, potentially in individual stocks is another matter, but to be buying the index itself.
And this is what I was talking about in the video because we had… We’re only a couple of percent below a big overhead resistance level. So, the upside potential compared to the downside risk was skewed against the entry point. And sure enough, we’ve had the pullback. Now the pullback so far has come right back into the Fibonacci region. So, using the January low and the February high as our points to calculate the Fibonaccis, we’re right back into that range. We’re currently just above the 50%. Also coincides with where these moving averages are, the 50-day and the 100-day.
Now, if we’re going to see buy the dip, this is that classic point where the buy the dip would often occur from but often occur from the Fibonaccis, from the moving averages. I’m not saying that’s what’s going to happen, but this is where it could potentially happen from. So, let’s watch the ASX 200 over the next week and see whether this support starts to hold seat, we start to get the rally. I’m not convinced there’s a hurry to do a whole lot at the moment. This could potentially consolidate for several weeks before anything of great interest happens. But it’s just a good lesson in knowing when the asymmetry is not in the trade. Buying just beneath resistance is often a strategy for disappointment as the market pulls back.
Now, I want to jump over to copper. Copper has been really interesting over the last week. So, situation on copper, big rally during 2020, ’21, and a large sideways period giving way into a significant correction. What’s been happening over the last eight months now, we’ve started to have this upward-stepping pattern in copper where the copper will rally, it will go sideways for a couple of months, then have another rally. This is looking entirely corrective, this move we’ve had so far. And just this week, we saw a strong rally off support at four dollars. So, you can just see this four-dollar region. It’s been an important area over the last couple of years for copper. We broke above four dollars in January, we’ve pulled back to it, and we’ve had a strong rally off it this week.
So, we can also put some Fibonaccis on just using the January low and the January high. And you can see it coincides with where the market has come back to, also those moving averages are there. So, you’ve got this cross-sector of supports coming in. So, a really significant area to be aware of in copper. And also, you can call this an asymmetric entry point because you know your risk. Should copper break back down towards say around 380, it starts to disengage that upcycle that’s been occurring since last year. But the upside potential is that the market continues to rally back up toward previous highs. So, this seems to be one of those asymmetric situations where you can manage risk but the upside is there. So, keep an eye on copper. I think this looks quite corrective.
I’ll give you an example of a copper stock which I’m watching. This is a stock, Copper Mountain. This is a Canadian listing, the TSX listing. It’s also listed on the ASX, the Australian Stock Exchange. And it’s not as much volumes. It’s relatively thinly traded in the Australian market, so I’m using the Canadian one as the example. And it’s an interesting stock because it seems to be highly leveraged for the copper price. We had this great boom when copper was running during 2020, 2021, then as copper started to come off the boil, we’ve had the big bust correction. And now like copper, we’ve got this. Looks a bit like a set of stairs when you look at it in that we go up and then we go sideways. Currently doing the sideways motion. It’s bounced off important support just below two dollars. Had this strong bounce in the last couple of weeks. Just having a pullback at the moment, and then the bounce also coincides with the moving averages. And let’s just put some Fibonaccis on and see what we get. And yeah, there we go. Put the Fibonaccis on from the Jan low and the Jan High. And this recent pullback has come right into the Fib range and now we’re getting the bounce.
This is a stock to watch if you’re interested in copper I think. Again, I think there’s a good asymmetry to trading this stock and potentially investing in it. We’re getting this pullback towards the moving averages. Potentially presents the setup for taking a position. Upside potential looks highly encouraging. Downside risk can be managed below this support, below the moving averages. Something to think about, something to keep an eye on.
So, let’s leave it there for this week. Thank you for joining me. Hopefully, that’s been interesting. Hopefully, it gives you a few ideas of what could be going on in these markets. I look forward to coming back and talking to you next week. Until then, bye for now.
Please see video for more detailed analysis and charts
Looking for the best ASX stocks to buy now?
Motion Trader‘s algorithms scan more than 2,000 ASX stocks daily in search of medium term investment trends. We then tell our members precisely when to buy shares. And most importantly, we tell them when to sell.
Try a no obligation FREE 14-day trial of Motion Trader, and see what an algorithmic trading approach could do for you.
Meet Jason

I'm Jason McIntosh, the creator of Motion Trader. My career began in 1991 on the trading floor at Bankers Trust. Nowadays, I trade my own systems from home in Sydney.
Motion Trader is for investors who value robust analysis, data driven entry and exit signals, commentary, and education. I use engineered algorithms to identify when to buy and sell ASX stocks. No biases or guesswork, just data driven signals.