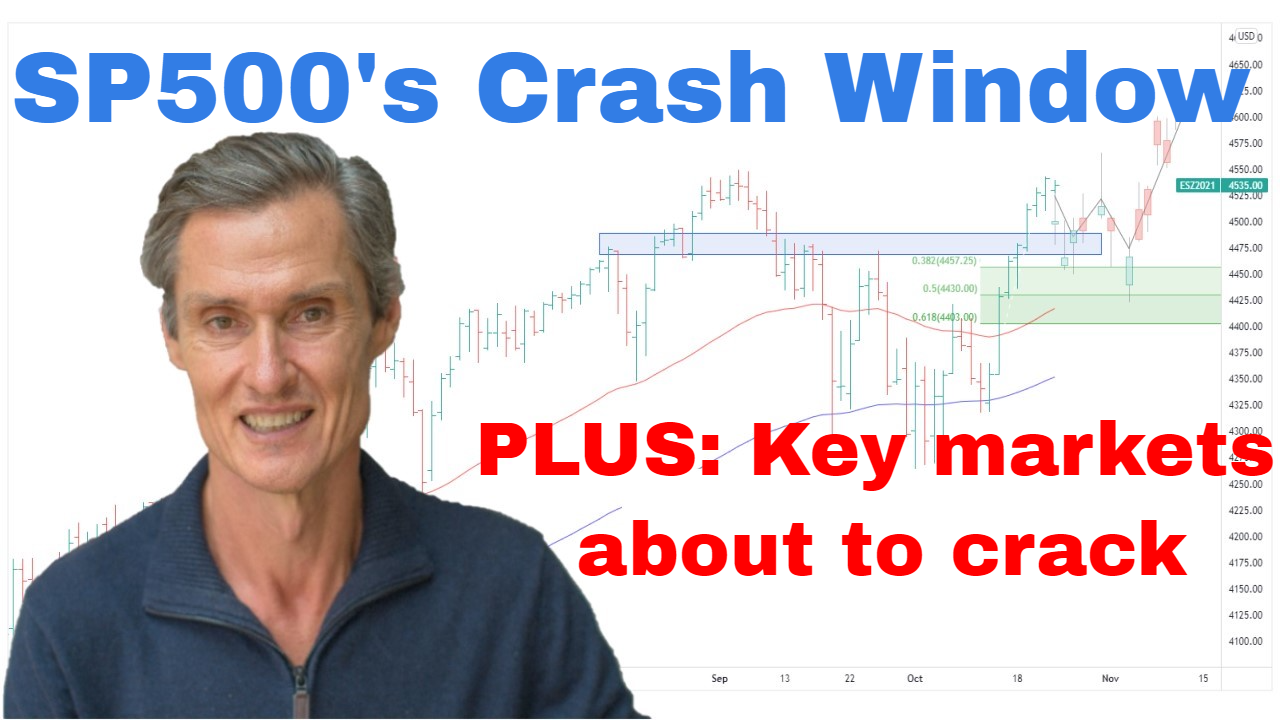
SP500 Opens Crash Window | Episode 71
Where is the Stock Market Heading?
00:00 Intro
00:33 What the breakdown means for next week
02:25 This is what needs to happen neutralise the sell cycle
04:34 How I’m playing the latest breakdown
06:20 This is why a crash is far from certain
09:43 But this important group of stocks suggest more downside
Transcript (abridged)
Please note: Charts available from video
So, here we go. We’ve got the S&P 500 up on the screen. And geez, it has been an ugly week of price action for the S&P 500. And prices have now…they’re broken down below this support band. So, we’ve been watching this support band in here around 3900, and we’re now broken below there. And I think that puts the S&P 500 in a very vulnerable position. I think the fact that the S&P 500 has broken this support zone and that it’s below the 50 and the 100-day moving averages, I think that calls for some extreme caution as we move to the end of the current week and into next week.
I think if we’re going to see a sharp decline, then the market is now set up for that to happen. Now I’m not saying that that’s going to happen because, of course, I don’t know. We don’t know what the market’s going to do here. Lots of people are going to speculate about it’s going to do this, it’s going to do that, but none of us really know. But I think the window is now open for something ugly to occur.
But I’ve got to qualify that by saying betting on a crash is always a lower probability event. So, you just always got to bear in mind when you’re looking for sharp moves down. But as I said, the S&P 500, it does have the setup from which a big and a fast move lower could occur. So, I think also with much of that September nervousness in the market at the moment, current levels, I think we just can’t rule that possibility out.
Now I think the key feature on this chart remains this downward trend line, three-point downtrend line which has been in place since the high at the beginning of the year. And with that firmly intact, the primary trend remains down. And I think the first step in breaking the current sell cycle that we find ourselves in, I think the first step in that would be breaking back above this resistance band at around 3900. So, this was support, and once support breaks, support becomes resistance. So, the first step in breaking this sell cycle is to have the market break back up above there. And we can also put some Fibonacci retracements on from the high a week ago. We’re using the current low. We don’t know whether that’s going to actually be a low of substance, probably not at all, but if it were, if the market were to bounce from here, just gives us ideas as to where it would need to get to break that sell cycle.
So, looking at these Fibonaccis, they do come in around this resistance band at around 3900. So, I think that’s very much the mark to watch to see if the market can move into a more neutral state. And so while this level is intact, we could get…This is a thing to remember. We could get a 3% rally from here. We could get a 3% rally back to this resistance band but still keep the sell sequence in place. So, from there, the market could then turn lower again and the sell sequence could remain in place. So, even a rebound doesn’t neutralize this market at this point. It really needs to get back above this resistance band to get things back to at least a neutral state, not necessarily even a bullish state but just neutral. At the moment, we are in a high-risk sell sequence which could unravel considerably from here. So, it’s something we need to be mindful of.
And if you’ve been following these videos for a while, you know that my approach since back here in early July has been to incrementally get some exposure to the market, not a lot but just enough to have a base position in the event that prices pull back and then had another leg higher. Not necessarily a new bull market but even just a prolonged hopping formation would have seen the market go higher. But I think what we’ve got now, it’s been a case in the last few weeks holding the line to see whether this support would hold, but now with this support giving way, I think the prospect of that larger rally is a whole lot less likely. And I’ve actually unwound some of the positions which I put on during this rally. I’ve still got market exposure but I’m mostly in cash. It’s not about fighting the market at this point. We have a primary downtrend. The rebound we had hasn’t materialized into a larger rebound, so it’s not now a time to dig in and fight the market. The trend is down. We need to respect that.
And now if you’re getting some value from this, please hit that like button, and please hit the subscribe button if you haven’t already. And also please leave a short comment, just, “Hey, Jason, thanks for the video.” It helps so much. It tells YouTube people are watching, people are engaging, and YouTube shows more people. Now if that’s happening, well, then I make videos. It all works. So, that helps me heap. So, please do it because it takes a lot of time to put these things together for you, so I really appreciate that so much.
And I think the biggest reason for the market not to crash at the moment is that sentiment is just so extremely negative. And markets typically don’t crash when everyone’s watching and everyone’s waiting for the crash to happen. So, I saw a survey came out through the week. It’s the AAII sentiment survey. So, that’s the American Association of Individual Investors. And they’ve been doing these surveys since 1987. So, this came out through the week. So, this is for up to the 21st of September. Came out showing that 60.9% of respondents are bearish on the market. Now that’s a lot. It’s one of the five highest bearish sentiment readings in the survey’s history, and that goes back to 1987.
And so I see these big sentiment readings. They’re just hard to really say, well, a crash is on when so many people are negative. Of course, this doesn’t mean that the market has to go up, but we do know that bearish extremes do occur around lows, while this one here, while this is now getting…it’s very much in that extreme zone. Of course, we don’t know if it’s going to get even more extreme. So, it does keep that window open for further selling from where we currently are now, but it’s something to keep in mind.
And another factor that makes me a little bit hesitant towards this idea that a crash has to happen, which so many people seem to believe as a foregone conclusion is that market is also very oversold at current levels. So, if we just look at this, this is showing the number of stocks, number of S&P 500 stocks above their 20-day moving average. And several weeks, we’ve been right down here at the bottom of the range. Currently, it’s just 5% of stocks above their 20-day moving average, and this is on a weekly. I’m looking this on a weekly graph.
And so let’s get a little bit more data on this. So, this goes back to about 2008. Here we go, back to 2007. You can see when the market gets down to this oversold level, it doesn’t stay down here for too long. We’ve been down here for several weeks, so the possibility that it’s going to remain down here for several more weeks, well, it would do something which it hasn’t done before. So, from that basis, from the overly negative sentiment, and from the oversold state of the market, it does make me wonder whether a crash would happen, whether it could happen. Of course, it’s always a possibility, but there are reasons to believe that maybe the market continues to sell off but it does then stabilize. We just don’t know. We’ve just got to wait and see.
Now I quickly want to show you some more charts of concern. And for this, we’re going to jump over to Europe because this is interesting. We don’t often look at the European markets, but they’re really getting to a critical level at the moment. So, this is the EURO STOXX 50, so the largest 50 European stocks. And it’s coming right down to a key support zone at around 3370, also below the 50 and 100-day moving averages, and it’s approaching this support zone with a bit of momentum. So, I think the risk here is that this support zone gives way and the market continues to unravel. And the price action since March has also formed what we call a descending triangle. So, descending triangle works like this. So, you’ve got your top trend line, and then you’ve got your bottom trend line. And so you’ve got the descending line on top and you’ve got a flat line on the bottom.
And the theory with the descending triangle is that the sellers progressively get more aggressive as you move towards the apex of the triangle, whereas the buyers just hold the line. And ultimately, the sellers overrun the buyers and you get the price falls away. At the moment, it looks like the buyers are about to be overrun. So, this is how the European market is looking. Europe breaks down. You’d expect it’s all part of a broader global equities sell-off. So, it’s something really important to watch. Same structure is evident in the Euro STOXX 600. It’s sitting on this big support zone. And when we go to the German market, the DAX, it’s got the same pattern. The DAX is…it looks like it’s starting to roll over, and that has a potential to continue to fall away. So, it’s something I think we need to keep a close eye on.
Looking at the UK, it’s got this large triangle trading range, and it looks like, well, it is testing the lower support of that triangle. If that breaks, that has a measured count for a fall of upwards of 10%. So, significant things going on in Europe. So, I think the deterioration in the price action that we’re seeing opens up some extra risk going into September. And if you’ve been following these videos for some time, you know it’s all been about playing defence, for much of this year is about playing defence. Nothing has changed there. Could be an interesting week, so let’s watch it closely.
Please see video for more details analysis and charts
Looking for the best ASX stocks to buy now?
Motion Trader‘s algorithms scan more than 2,000 ASX stocks daily in search of medium term investment trends. We then tell our members precisely when to buy shares. And most importantly, we tell them when to sell.
Try a no obligation FREE 14-day trial of Motion Trader, and see what an algorithmic trading approach could do for you.
Meet Jason

I'm Jason McIntosh, the creator of Motion Trader. My career began in 1991 on the trading floor at Bankers Trust. Nowadays, I trade my own systems from home in Sydney.
Motion Trader is for investors who value robust analysis, data driven entry and exit signals, commentary, and education. I use engineered algorithms to identify when to buy and sell ASX stocks. No biases or guesswork, just data driven signals.