SP500 on the Brink: Investors Brace for Sell-off | Episode 94
By Jason McIntosh | Published 16 December 2022
Where is the Stock Market Heading?
00:00 Intro
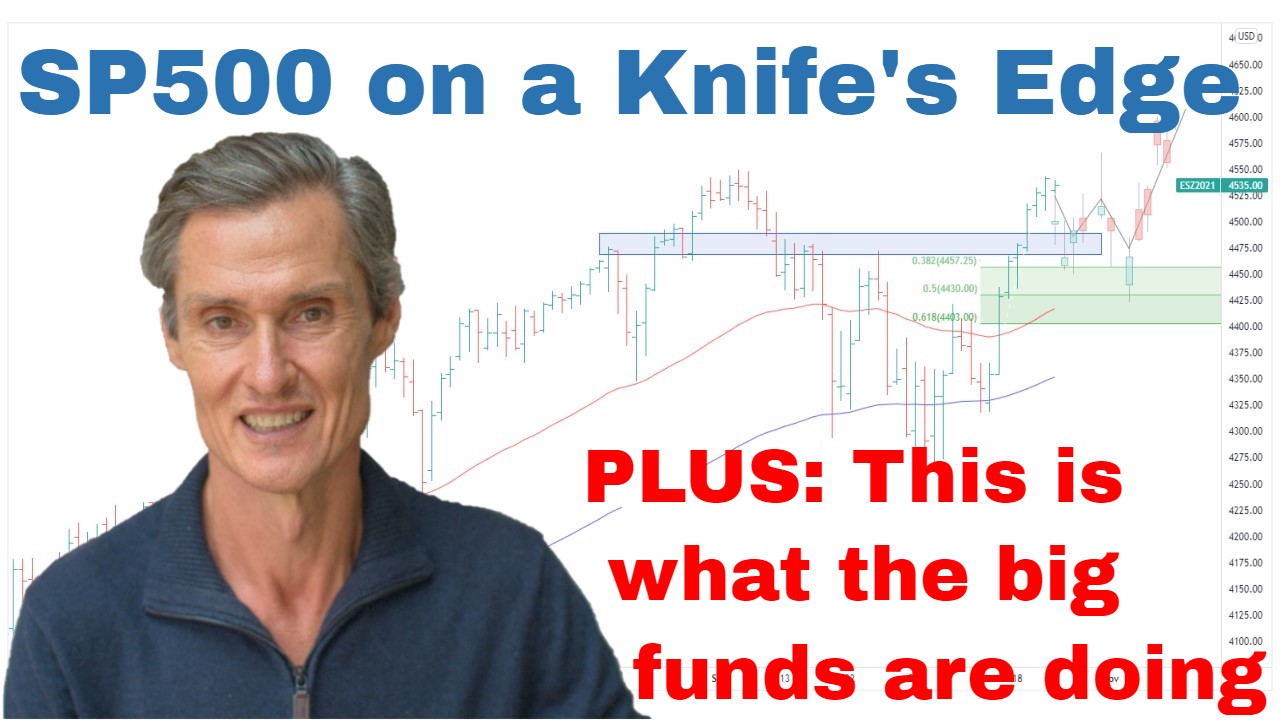
00:30 SP500 on a knife’s edge
04:48 The bearish assessment of SP500 (watch out for this)
05:55 But don’t overlook this positive possibility
07:24 This is investors’ greatest fear
08:40 No one is talking about these bullish possibilities
11:30 I’m doing this with my SP500 position
12:57 Look at what the Dow is doing (and what I think happens next)
15:20 You won’t believe how the big fund managers are positioned
Transcript
Please note: Charts available from video
This video is going to focus on the S&P 500. I’m going to cover the ASX 200, gold, and uranium in a separate video, and I’ll leave a link for that in the description section below. I’ve also got a fascinating graph to show you. It gives you an idea of how the pros are positioning their portfolios. Really is interesting, so make sure you stick around for that. As always, this is general commentary and doesn’t take your personal situation into account. With all of that said, let’s get into our first chart.
So, we’ve got the S&P 500 up on the screen. And it has been such a fascinating week in this market. So, on Wednesday, we had the CPI release, and that resulted in a quick rally to the upside. Broke above this down trend line, this trend line which has been so watched over the last few months because it’s been in place since January. It’s got three distinctive touch points on it. Had another touch point in late November, early December, and then again this week. But the break above there didn’t last for very long. We got the rate hike, 0.5% rate hike shortly after and the market has been reversed course. So, I’ve been saying for the last…I think it’s probably the last three weeks now that I didn’t think the risk-reward of buying the S&P 500 was… I didn’t think it was in favor of buying over the last few weeks, and the reason was because the market was just so close to this downward trend line, and there’s also some resistance around 4200, which I’ll talk about in a moment. And with the market so close to resistance points, it’s typically not an asymmetric time to be entering, and that remains the case now. With the market pulling back, for me, it doesn’t favor an entry point at this stage.
And I just want to go over to the hourly charts. But before we do that, let’s just have a look at this other resistance point which the market ran into this week, so around 4200, 4100 resistance band. Comes in around about here. And this was interesting during the week on that CPI release. We rallied right into that resistance zone and that rally was met with selling. So, there was distribution as we got into the resistance band and, of course, the ensuing pullback.
So, just going over to the hourly chart. Let’s break this down on finer detail, which is interesting to do. Here’s a CPI release. You can see the rally. It was really a one-hour event. We had this big spike upwards over the hour following the announcement, but then it was a case of selling, and for one session the market tried to hold the line, tried to consolidate, and maybe have another attempt up but didn’t follow through, and then the selling has continued since then. And if you’re wondering, I’m filming this on Saturday morning my time, so I’ve got the U.S. session for Friday, and I’ve done that because the price action on Friday in the U.S. I think makes a difference sometimes. A lot of the time, one day doesn’t make that much difference to the overall view, but today it does because of how the market has been trading through Friday through some important support.
And if we just compress this a little bit, it’s also interesting. We’ve been watching this big support band around 3900 for a while. You can just actually find that up a little bit more, and you can put in a secondary support or a finer support level which came in around 3920. Interesting. It has the October high and a couple of touchpoints during November. So, it’s been an area where the market has really found good support. There’s been buying the dip around this 3920 level. Tried to find support last night but it’s since broken through. So, I think that’s something significant that we need to take on board and consider for what could be happening coming weeks.
Now just going back to the daily chart. So, looking at this daily chart, I think the bearish assessment to make from this, so when we look at, okay, what’s negative about this is that we’ve had two failed breaks higher which had been sold into. So, we had this break higher when Governor Power was talking about slowing the interest rate increases. That was met with selling and the market pulled back, and then we had the lower-than-expected CPI, we had the rally, then, of course, as we’ve been speaking about, it was sold into. So, there’s distribution at higher levels. There’s interest in selling into the market. So, that would support the case that this is potentially just been a bear market rally. I’m not saying that that is the case, but it lends support to that way of thinking. And based on that, well, then you have to ask, well, is the market now erring to roll over?
One of the positives which has been in place over the last month has been that all these dips have been supported. So, each time the markets rallied and pulled back, it’s found support several times over the last few weeks. And this is actually quite a different price action to what we’ve seen basically all year. So, if you look at these previous peaks and pullbacks, you don’t find really much evidence of the dip being bought at all. This is the first time we’ve had an extended period where there has been underlying interest in supporting the market. But, of course, with Friday’s price action, that’s no longer the case. This area has broken and the market has traded. It’s traded as low as 3850 thereabouts on Friday in the day’s session. Looks like it’s going to close in about 20 minutes’ time. It’s going to close back within this blue-shaded area, but nonetheless, making a new low that we haven’t seen since early to mid-November.
So, that does open the window to more downside. We can’t ignore the fact that this support has given way and that it could open the window to some more downside. I think the big fear in the market at the moment with a lot of people is that that means that we’re going to head down and head to a new low and that we’re going to have another episode like the decline from the March high or the August high. I think that’s the fear. But when I assess the overall technical position of this market, I don’t think that’s the case. I don’t think it’s at least set up that way at the moment. I still think this could all be part of a large basing formation that could potentially underpin the market for several months. I think the obvious call to make is that support is broken. Here we go again. We’re going back down to a new low. That seems to be the overwhelming consensus when you look at Twitter and you talk to retail traders. They think recession is coming. This is it. We’re heading down to a new low. And it could happen. Absolutely, it could happen.
But the point I’d make is that when so many people think one thing, market often does something else. So, I think we need to be aware that there are other possibilities that could play out. For starters, I’d like to see how the price action develops over the next few days. Is there going to be follow-through selling now we’re broken below these lows from November and we’re edging through this big support region which has been in place since around May? Will there be follow-through selling that starts to push the market down? The most positive scenario would be that the market now, as we’re closing on Friday, is edging back into this blue region and hasn’t closed below it. So, the most positive scenario would be there’s no follow-through selling, and next week we find that the S&P 500 is back mid-range to where it was during this week, which then sets it up to creating a base that it could break upwards from. That would be the most positive scenario.
Another scenario is that we do get some follow-through selling. Maybe we get a rebound early in the week because it has been a big decline from that Wednesday high, but then we do get some follow-through selling. And as people get concerned, well, this is it, we’re going down to a new low, market doesn’t make that new low. Finds support and then starts to rally, and then maybe into January, mid-January, we get a break upwards. If you got a bit of a chart eye, you might recognize a pattern here. Of course, it’s the inverse head and shoulders, so that being the head in October, we have a shoulder in June. Potentially there’s a shoulder forming now. This is just a possibility. It’s not a prediction by any stretch because these markets can go in so many different directions and so many different possibilities.
But it’s just one that I have in mind because it would fit the psychology of the market at the moment in that there’s fear that the market is going to decline to a new low. If it does decline, if it doesn’t make a new low, it does set up that possibility that it then does start to turn higher for whatever reason that may be. I know the macro environments. People tell me that each week when I say there’s a possibility the market could rise. It’s not about fighting the Fed, it’s not about trying to buck the macro. It’s just looking for possibilities that we need to be aware of. And this is one. So, I don’t think what we’re seeing on Friday means that we should now be flipping and going, “Okay, this is got to be bad.” Market had three down days. A guy sent me an email this week saying, “The market is melting down. What do I do?” It’s not melting down at this point. We need to keep our perspective with what’s actually going on.
I’m still long the S&P 500 from this position I put on after the CPI a couple of months ago. I’ve also got positions in individual stocks. I’ve also got plenty of cash. So, it’s not an all-or-nothing proposition for me. I’ve got a foot in both camps. I’ve got an open mind to upside, but I’m aware of the risks and so I’m holding plenty of cash, and I’ve also got an eye on the exit. If this price action really does start to deteriorate, I’m not holding in there saying, “Well, the market…” Maybe it can still go up. It’s not about fighting the trend at the moment. We do have that momentum from the low two months ago. We don’t have definitive signs if that momentum is gone and that the market is now rolling over. So, just keep an open mind about managing risk at this point.
Now, if you’re getting some value from this, please hit that like button, and please leave a short comment, just “Hey, thanks for the video.” It just tells people YouTube are watching. Also, tell me what you think. Do you think this support is going to give way out? Tell me, do you think…? Are we heading to a new low? That’d be an interesting question. Do you think we’re heading to a new low? Let me know in the comments section below. Let other viewers see what you think. Hit the subscribe button if you haven’t already done so. And please do that because these things make so much difference to me with the way YouTube pushes the video out because that be a great help if you did those things. And let me know what you think. I’d love to know.
And now let’s have a quick look at the Dow. The Dow is interesting. I’ve been saying over the last few weeks that the Dow was stretched above these moving averages and was also up here within a resistance region, and that increased the odds that we’re heading toward some sort of a consolidation because as you often hear me say, when the market is stretched above the moving averages, the moving averages act a bit like gravity, market tends to come back towards those moving averages or at least pause while the moving averages catch up. That’s what’s been going on in the Dow over the last week. So, this pullback shouldn’t come as a surprise if you’ve been watching the videos because it’s the scenario we’ve been outlining for the last few weeks. I think the most likely scenario is that we continue to consolidate below this resistance band at around 34500-ish. I think more consolidation below there is the most likely scenario. This is not set up for an imminent return to bearish conditions.
Now, look at this chart. People fearing the market is about to plummet to new lows. Now, look at the Dow. That is not the setup which the Dow is suggesting. It is still trading above the moving averages. So, I’m using the 50 and the 100-day moving averages. The moving average is still positive, and I think that this chart structure is more supportive that a basing period is underway. You need to remember we had a 20% rally off this low and it’s just normal for a rally of that magnitude. It needs to be checked. It needs to be corrected and consolidated, and that’s what’s happening at the moment. Now, this price action could evolve and it could turn into something which does roll over and does become bearish. That’s not the picture we have at the moment. We need to deal with the data we have and base our decisions around that. So, I really want to watch how this price action develops over the next few weeks and see what it tells us, and we can make some more calls from that. Probably not an asymmetric entry point. Still a lot of uncertainty. Let’s wait and see how it starts to play out.
Now, I want to show you a really interesting graph I saw through the week. And this turned up in my Twitter feed. Now, this is from the Bank of America Merrill Lynch Global Fund Manager Survey, and it’s telling you the net percentage asset allocators have been overweight equities versus bonds. So, when we got this big blue area, that’s where these big asset allocators are overweight equities, when we’re below the line, they’re underweight equities. So, three periods of underweight in this 21-year period. So, during the GFC, underweight equities, brief period during the COVID crash, underweight equities, and here we are here in December 2022, and again, we’re underweight equities.
Now, this doesn’t mean stocks need to bottom today and need to rally. Interesting to just keep this in mind because we do know that, of course, they can become more underweight as we saw in 2009, and it can last for a while. But what’s interesting to take on board with this is that the popular view is that lower levels have to happen. But this is why I think we should always keep an open mind because, for whatever reason, if equities are able to establish a base and they are able to master up a rally or a continuation of that rally we’ve seen over the last couple of months. This underweight position then provides fuel for a rally. So, again, it doesn’t mean a rally is going to happen, but we can see a fuel supply for a rally if a rally is to eventuate. So, it’s just keeping an open mind to possibilities that could drive those possibilities that they happen.
So, it’s been a really interesting week in these markets. I hope you found today helpful. Hope you found today’s video helpful. Coming back next week and going through the next set of price action with you. So, thank you for joining me.
Please see video for more details analysis and charts
Looking for the best ASX stocks to buy now?
Motion Trader‘s algorithms scan more than 2,000 ASX stocks daily in search of medium term investment trends. We then tell our members precisely when to buy shares. And most importantly, we tell them when to sell.
Try a no obligation FREE 14-day trial of Motion Trader, and see what an algorithmic trading approach could do for you.
Meet Jason

I'm Jason McIntosh, the creator of Motion Trader. My career began in 1991 on the trading floor at Bankers Trust. Nowadays, I trade my own systems from home in Sydney.
Motion Trader is for investors who value robust analysis, data driven entry and exit signals, commentary, and education. I use engineered algorithms to identify when to buy and sell ASX stocks. No biases or guesswork, just data driven signals.