SP500 on EDGE of Capitulation | Episode 47
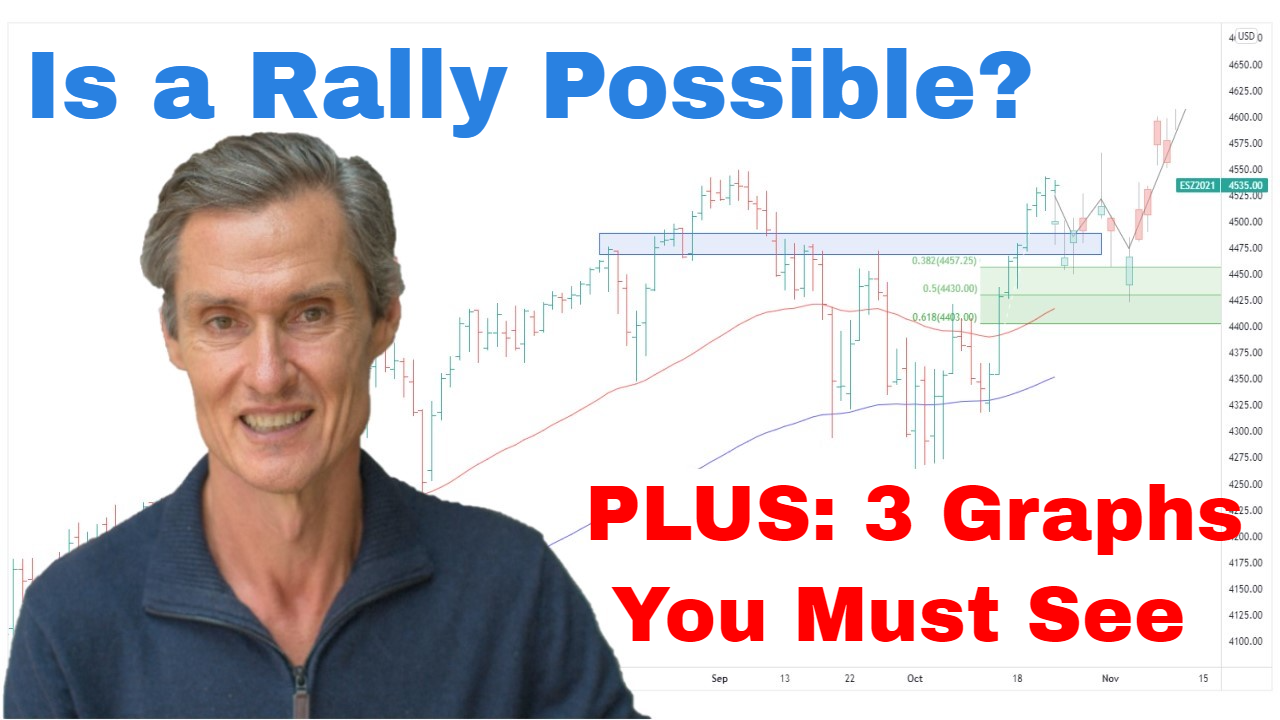
By Jason McIntosh | Published 2 July 2022
Trade the Trend is a weekly video focusing on where the stock market is going. It’s for investors and traders looking for insights to the market’s next move. Jason uses technical analysis of stocks and trend following techniques to help you piece together the world’s biggest puzzle.
Where is the Stock Market Going?
00:00 Intro
00:23 Where is the S&P 500 heading?
01:55 S&P 500 has bullish divergence in a key technical indicator
03:20 Bond market signalling stocks could rebound
05:47 Key levels to watch in S&P 500
10:22 Small option traders are historically bearish
11:12 More stocks below cash value than 2002 or 2009
12:20 Check out this major shift in investor behaviour
15:31 Where is the ASX 200 going?
Transcript (abridged)
Please note: Charts available from video
Let’s start with a chart for the S&P 500. For the past couple of weeks, I’ve been talking about a cascading or waterfall-type pattern which has developed.
Have a look at this:
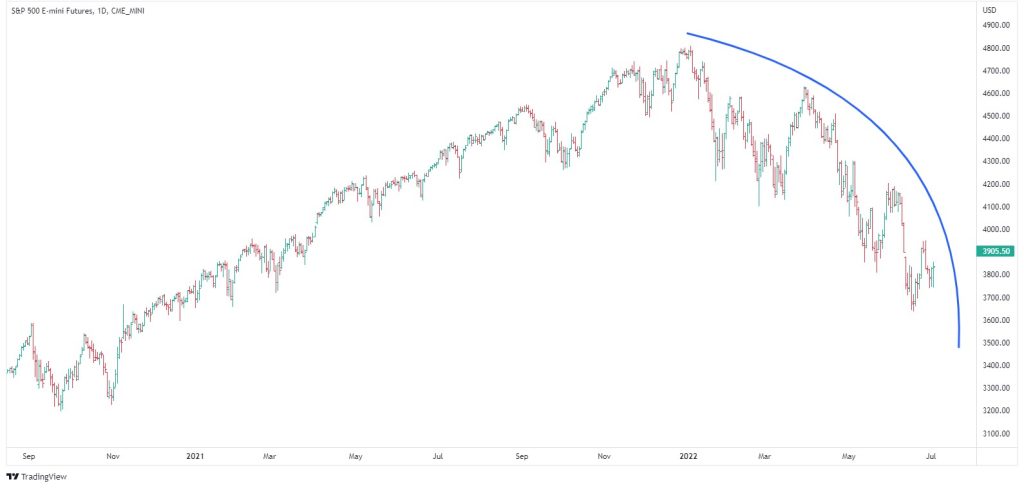
You can see this blue arc over the top of the price action. The way these cascading patterns work is that the rallies start off routinely. They may take several weeks or months to play out before another sell-off. The next rally tends to be shorter and shallower, and then you get another acceleration lower with an even shorter rally, and then another acceleration into the capitulation of the move.
It doesn’t always work out like that, but that’s what the set-up can potentially do. And so this pattern has had us on red alert for the U.S. equity markets over the past few weeks, because the risk of a capitulation sell-off has been in place. But as of Friday’s close, there are some signs that the S&P 500 is going to attempt to rally from here.
Now, there are a few clues to this puzzle, so let’s go through them. I’m going to start by putting on an indicator called the Advance/Decline Line. The Advance/Decline Line provides the cumulative number of stocks advancing versus the number of stocks declining (you can see it here in the video).
In the last several weeks, the Advance/Decline Line is showing some divergence. It didn’t make a new low during the most recent sell-off in the S&P 500. So, the new low in the S&P 500 wasn’t confirmed by the Advance/Decline Line. That’s a positive for the market. The Advance/Decline Line can be useful at turning points, especially when there’s divergence.
The main thing which is shifting my view towards a potential rally is what we’ve seen in the U.S. 10-year bond on Friday in the U.S. Let’s just start by going to a monthly chart, and I want to put this into perspective (see video).
Bonds have been in a 37-year trend channel. And in April, the bond yield broke higher. It’s the first time it’s broken from the channel since the 1980s. So, that is a significant move, and that’s one we’re going to continue to need to watch over the months ahead. And it’s really been this relentless rise. We’ve seen this relentless rise in yields on the concern of inflation.
Now, let’s just go back to the daily chart.
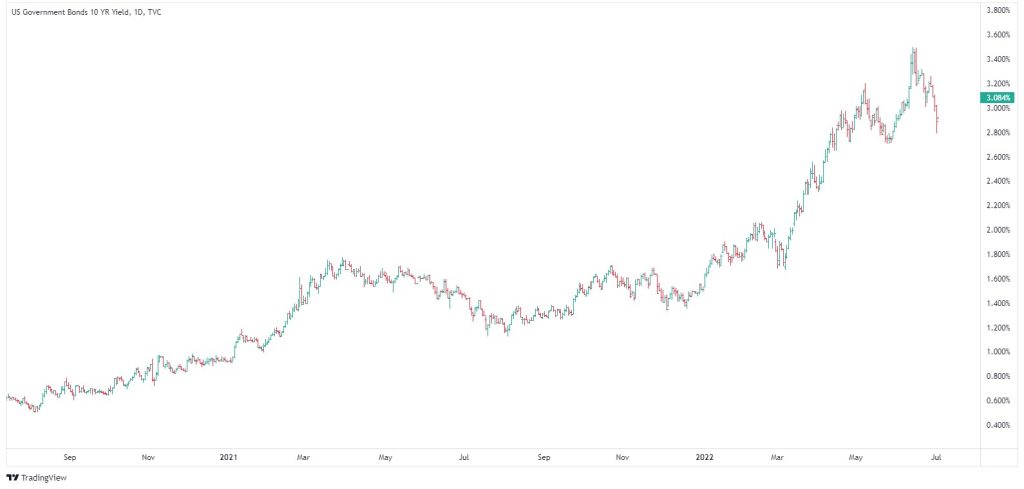
I think Friday’s decline in yield breaks the upward momentum that we’ve seen over the last several months. This has been the largest fall in yields for some time. So, I think that breaks that upward momentum. And if the heat comes out of the bond market, then I think it takes some of the downward pressure off the stock market. It doesn’t mean a new bull market in the stock market, but it potentially does mean that pressure could come off, at least temporarily.
I’m not saying this is going to be a high in yield, maybe the bond yield consolidates for a period of time. We need to watch that one as it plays out. But for now, that upward momentum does seem to have been broken.
Now, let’s go back to the S&P 500. I’m going to show you a four-hourly chart so we can focus in on the latest decline. I’ve also put on the Fibonacci retracements.
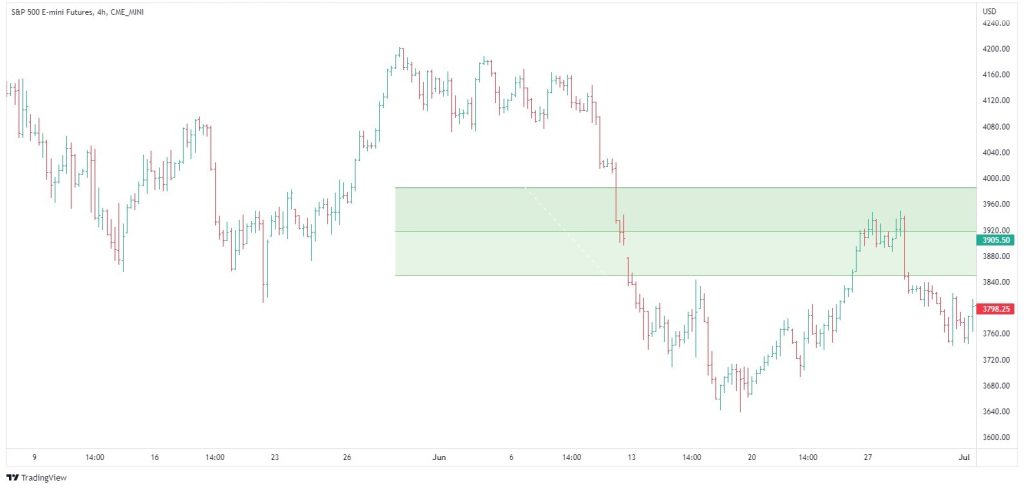
What we can see is that the last week has come right up into the Fibonacci zone. It’s then been quickly rejected near the 50% mark. The key is what’s going to happens in here? And I think the key to this is going to be in what happens say about 200 points either side of where the S&P 500 is now?
I think the key level on the topside is around 4,000, which is around the top of the Fibonacci range. On the downside, the level to watch is 3,600, just below the recent low.
There are two scenarios…
Firstly, the S&P 500 could retest the high from last week. And should it be able to punch above that high… get above that Fibonacci region above 4,000, then it opens the possibility of an upward acceleration and short-covering coming into the market. And that’s where we get that potential stronger rebound starting to develop.
The alternative scenario is that it keeps rejecting away from the Fibonacci range. And that next week, we come in and the market starts to fall away again. And should it retest that recent lows and break, the potential opens up that the downside re-engages again, and we see that capitulation sell-off.
I have to say that my optimism for rebounds over the past couple of months has been wrong and the markets continue to unravel. But that said, I think with the bond market falling, my feel is that the market may try to rally here.
I want to be clear about this. This remains a vulnerable market. The S&P 500 remains below its 50 and 100-day moving averages. I’m not looking to buy this potential bounce in the price, should that develop. But I think the odds of a capitulation sell-off from this waterfall or cascading-type pattern are diminishing, at least for now.
If we do get a rally, we want to see how that price action develops, then we can make further analysis of that. This may not be a lasting low, even if we did get a rally. But I’m just saying that the odds of the capitulation sell-off occurring in the next several weeks are diminishing.
It’s always so tempting to try and pick the low point in these situations, but it’s so easy to get it wrong. I think we need to respect the downtrend that is still in place, and I think we need to continue to play defense.
But we also need to look at the clues around us and not get stuck into a state where we remain overwhelmingly bearish or indefinitely. We need to look at the clues and recognize that conditions could be shifting, even if only temporarily. Maybe we get a modest bounce and then a retest of the lows later in the year. No one knows. We just have to watch the price action as it develops, but there are signs to be encouraged that the market may avoid capitulation sell-off the near term.
Please see video for more detailed analysis and charts
Looking for the best ASX stocks to buy now?
Motion Trader‘s algorithms scan more than 2,000 ASX stocks daily in search of medium term investment trends. We then tell our members precisely when to buy shares. And most importantly, we tell them when to sell.
Try a no obligation FREE 14-day trial of Motion Trader, and see what an algorithmic trading approach could do for you.
Meet Jason

I'm Jason McIntosh, the creator of Motion Trader. My career began in 1991 on the trading floor at Bankers Trust. Nowadays, I trade my own systems from home in Sydney.
Motion Trader is for investors who value robust analysis, data driven entry and exit signals, commentary, and education. I use engineered algorithms to identify when to buy and sell ASX stocks. No biases or guesswork, just data driven signals.