SP500 Key Reversal Set-Up | Episode 79
Where is the Stock Market Heading?
00:00 Intro
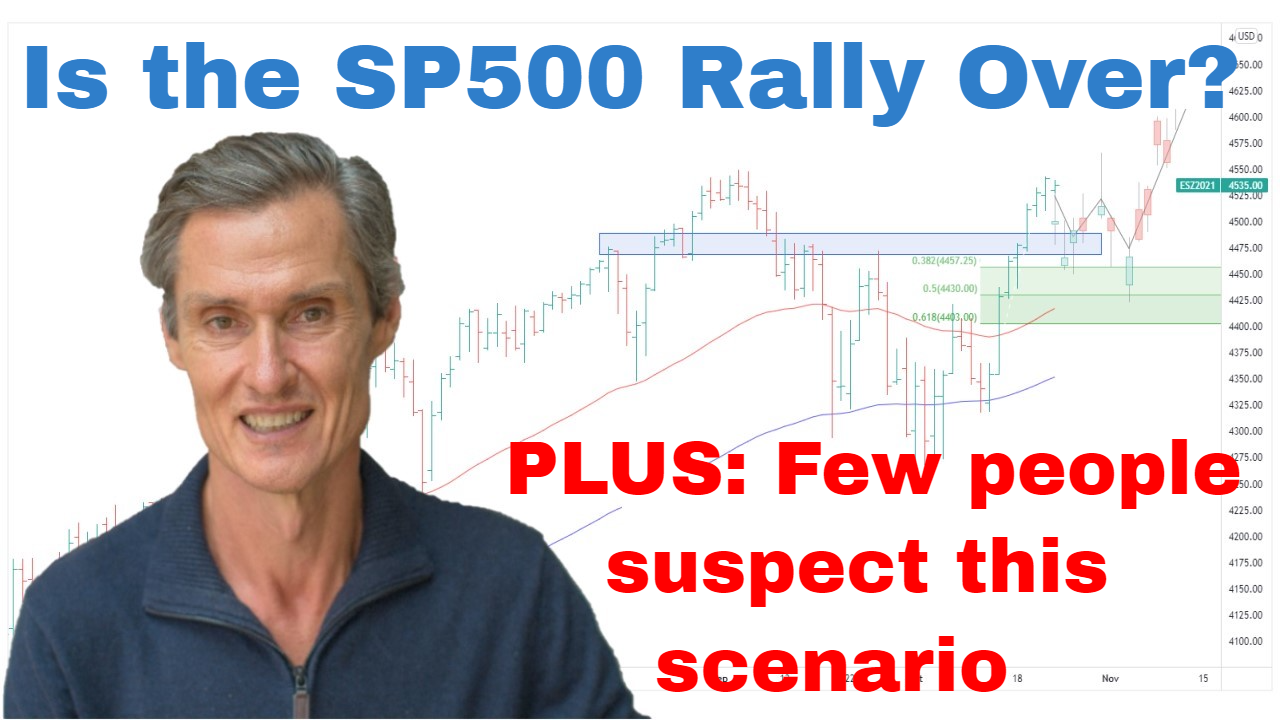
00:33 Is the bear market rally over (or is it just starting)?
03:43 Look what happened last time we saw this set-up
04:59 Watch for this key technical pattern over the next few days
08:00 Few people suspect this scenario
09:22 Be aware of this key Fibonacci level
10:41 Don’t lose sign of these undeniable realities
Transcript
Please note: Charts available from video
There’s been quite a bit of action in the S&P 500 since my last update. The S&P 500 fell almost 4% from its high last Friday before rallying again on Monday and Tuesday. And the question now is, was this all there is to the bear market rally, and are we about to head down to new lows? Now, I’ve got some possibilities that I want to discuss. And to do that, let’s jump over to the four-hourly chart just to get a little bit more detail in the price action. So, here we go. Here you can see the low after the CPI. And what we got from there, we got that big sell-off followed by the strong rally. This was last Friday’s price action where the market reversed. Some people thought, “Well that was it. The rally is all over and we’re going back down to new lows.” But then Monday, Tuesday we came back and made it to a new high for the last couple of weeks. And now we’re in a situation where the market is starting to lose ground getting into the Friday’s open.
Now I know some viewers would like me to be recording these after the Friday close. Problem is that is at 6:00 a.m. Saturday for me, and unfortunately, that’s just not a sustainable window to be preparing and releasing these videos because they take quite a while to do. And thing to remember, though, is I’m looking at this from the overall chart structure, not just one session. So, from my perspective, the setups and the possibilities typically don’t change based on one day’s price action.
So, just getting back to this chart. So, last week, I spoke about the potential for a bear market rally, and I said it could potentially last several weeks. And maybe the target for that was around this 3900. We’ve got this resistance band coming in at around 3900. That’s a possible target for a bear market rally. And that still remains my base case. So, yes, we already have seen a big rally off the low, but I think when you look at the S&P 500 from this August high up at around 4300, the market still appears, at least to me, and the measures I look at, still seems oversold. And I think the market’s inability to attract fresh selling when the CPI came out and we broke below this September low, I think the fact that we didn’t get that follow-through selling, it suggests to me that we’ve at least got an interim low in place and the market is going to explore what could happen on the upside.
It’s interesting to look back on this price action from February. So, if I just scroll back here. It was around just in here in February. So, what happened in February? So, we had this slope from January. February, we had a sharp sell-off, broke the January low, market quickly snapped back within a couple of days. Not dissimilar to what we’ve just seen. It was a fast rally. Market put on 7% in just two or three days, then it started to lose momentum. Again, not dissimilar to what we’re seeing now. In this case, it led to a multi-day decline. Got people thinking, “This is going to go down and make a new low,” but then it didn’t. It stabilized and went up for an extension of the bear market rally before we then got weaker price action in the months that followed.
And now what I’m wondering, I’m wondering whether something similar could happen this time in that we’ve had a two-day…well, not two-day. We’ve probably had about three or four days we’ve had a good move up, now we’re pulling back. And what could form here? What I’m going to look out for is the potential for a technical pattern called an inverse head and shoulders. So, let me draw up a scenario and explain what I’m talking about. And this is only a possibility. This pattern hasn’t even formed out yet. It’s just got the makings of this type of pattern. So, if we draw this in, this is called the neckline. What we have here, this is called the left shoulder. This is potentially the head of the pattern. Now if a head and shoulders were to form, what would happen, and then also looking at that scenario we saw back from February, if the market were to weaken a bit more over the next few days, maybe Friday into Monday, Tuesday, just a bit of sideways but not make a new low? Look like it’s going to make a new low, but pull up shorter, making a new low, then rally back towards this resistance point at the neckline and break above it. That’s one potential pathway to getting up towards this resistance at 3900. So, this would be a head and shoulders pattern, a shoulder, a head, and a shoulder. So, this pattern hasn’t formed as yet. I’m just mapping out one possibility.
And the psychology behind these head and shoulders patterns is quite interesting because how it works is the market will break to a new low, rally back, and then it will roll over and start falling again. And it’s during this phase here that people say, “Well, here we go again. We’ve seen this all before. The market is going off to a new low.” They position their portfolios for a fall, they get short, they exit stocks, the market doesn’t follow through to a new low, instead goes up, and that triggers the short covering and the reentries and fuels that rally.
So, I want to show you an example. I’ll show you an example from last year where we had a similar setup in the markets. So, this takes us back to September, October last year. I actually spoke about this at the time on the weekly video. This was during an upward trend, during the big primary upward trend, and this was how pullback…It was quite a meaningful pullback at the time included. So, this is the head and shoulders pattern just in here where we had the shoulder, we had the head, which made the new low, the rally back up, and then the right shoulder as the market appeared to be rolling down to retest and break these lows but didn’t, fell short, started to rally, and onward went the rally. So, it’s a possible pathway for how this could turn into a larger bear market rally.
And just something interesting. I’m going to show you how these…I’ll give you a quick example of how market can bottom. So, say this scenario plays out where we do get the rally, we get this head and shoulders pattern, we do get a continued rally. And if the market would then continue up to say get up towards this trendline before then having a reaction lower as it’s had three or so times earlier in this decline, chop around for a few months, and then start to retest this trendline, break above it, and then you have a head and shoulders low on a larger timeframe. That could potentially be a shoulder, that could be a head, and that could be a shoulder.
So, this is by no means a prediction as to what’s going to happen. This is getting too far ahead of ourselves. We don’t have anywhere near enough price action to make this, but it’s just interesting to map out possible pathways that markets can travel in. And this is the thing with technical analysis. It doesn’t tell you what the market is going to do but you can look at price action, look at setups, and then that helps you identify possibilities and prepare accordingly.
And I think another reason this may be a low point which at least has some staying power is due to when you put the Fibonaccis on. You can put the Fibonacci retracements on this whole advance from the COVID lows to the January highs. This low comes right down to the 50% Fibonacci retracement of this entire advance. Now, the thing with these Fibonaccis is they don’t work all the time but lots of people look at them. And so from that perspective, I think they’re well worth looking at. So, just having such an important low happening at a 50% retracement, it does give some weight to the possibility I think of at least a larger bear market rally than what we’ve currently seen.
So, now, if you’re getting some value from this, please hit that like button. Please leave a short comment, say, “Hey, thanks for the video.” It just tells YouTube people are watching, people are engaging, and if people do that, well, then I make videos. It really helps me so much if you can please do those things.
And now I just want to quickly balance this with what would appear to be a relatively positive outlook. I want to balance this with the realities of the situation as they currently are. I think we can’t lose sight of the fact that the market does remain in a primary downtrend. We’ve got this trendline in place. We’ve got the 100 and the 50-day moving averages continue to trend lower, and the market is currently below those moving averages. So, that puts the S&P 500 in a vulnerable position. So, yes, I think there is further rally potential up towards this resistance to around 3900, but I don’t think this is a time to be loading up on stocks by any stretch. I remain mostly in cash. I’ve got a selection of individual stocks that are showing relative strength. And I’ve also got a modest position in our S&P 500 ETF that I bought just after the CPI reversal a week or so ago. But overall, I remain highly defensive.
Just quickly looking at the NASDAQ, you can see that this is still a weak price chart. There’s no doubt about it. It hasn’t even been able to get to resistance at around 11600, let alone get above it. And then we look at the Russell 2000, the small-cap index and similar story, stuck below resistance at 1800. It hasn’t been able to rebound like the S&P 500. And that’s also not dissimilar to early this year where the market broke down below a support, tracked sideways, and then broke down again. So, this has broken support. It’s tracking sideways. There is always a very real risk that it does break lower again, which, of course, would probably then invalidate the bear market rally theory or thesis in the S&P 500. So, I think this is a case of continue to tread carefully. It’s just not a time for big positions in either direction.
Please see video for more details analysis and charts
Looking for the best ASX stocks to buy now?
Motion Trader‘s algorithms scan more than 2,000 ASX stocks daily in search of medium term investment trends. We then tell our members precisely when to buy shares. And most importantly, we tell them when to sell.
Try a no obligation FREE 14-day trial of Motion Trader, and see what an algorithmic trading approach could do for you.
Meet Jason

I'm Jason McIntosh, the creator of Motion Trader. My career began in 1991 on the trading floor at Bankers Trust. Nowadays, I trade my own systems from home in Sydney.
Motion Trader is for investors who value robust analysis, data driven entry and exit signals, commentary, and education. I use engineered algorithms to identify when to buy and sell ASX stocks. No biases or guesswork, just data driven signals.