SP500 Just Triggered RARE Signal | Episode 81
Where is the Stock Market Heading?
00:00 Intro
00:32 SP500 hits resistance (is the rally over?)
02:55 Watch this cluster of key levels
05:55 This is the price action to look for this week
08:24 Don’t lose focus of these realities
10:30 Look what this indicator is signalling (most people don’t expect this)
12:52 The bond market is provide an important clue
Transcript
Please note: Charts available from video
It’s been a really interesting week in the S&P500. And what we’ve had, we’ve had a rally of about 6% over the last week, and it’s taken the S&P 500 right up to this resistance band at around 3900. And just in the last day, just on Thursday, we’re already getting a reaction down from that resistance band. So, I’ll come back and talk a bit more about that in a moment. But first, let’s skip over to the four-hourly chart and just get a little bit more detail on this chart.
And so last week, I was talking about the potential of this pattern turning into an inverse head and shoulders formation. And this was around the point I was talking about. It was Friday afternoon my time, Thursday, just before the open on Friday for the U.S. I thought that we may have had a little bit more time developing this right shoulder, so a head and shoulders pattern. We have a shoulder, we have a head, which is a low point, and then we have another shoulder, and I thought maybe it was going to take another couple of days of this or it was up and towards this resistance point. So, we didn’t get this part. We didn’t get this extra little bit of work on the right shoulder. The market on Friday went straight up, broke through the neckline, and headed to that resistance band. So, I think that supports the view that this low we have here on the CPI release a couple of weeks ago, I think it supports a view that this is a bit more than just a short-term low before the market turns lower and makes a new low. So, I think from that perspective, I think we should be cautiously open to upside possibilities developing. Need more price action to see how it’s going to continue to develop, but I think that should be the base case at this point in time.
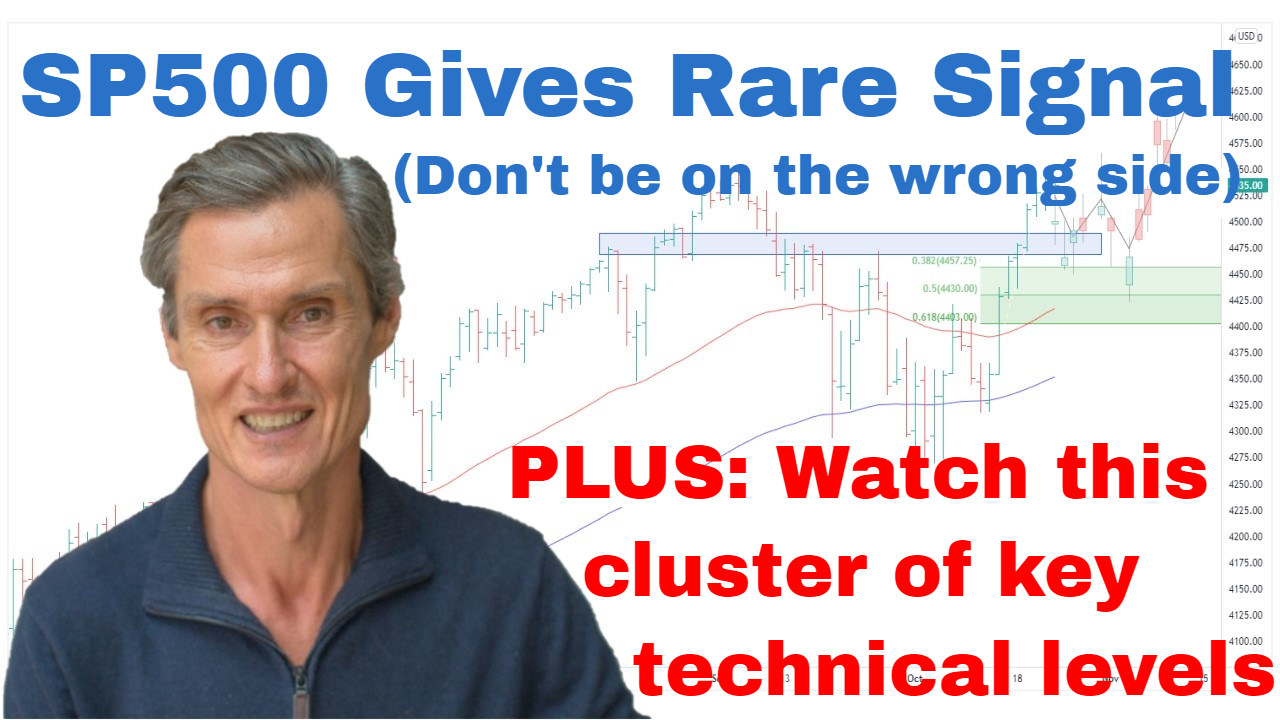
And it’s also interesting seeing the S&P 500 stalling at around this 3900 resistance because this has been a technically active region for a while now. It stretches back to May. So, you can see it’s held the market on several occasions, so held it through May, we got a rebound, and then on other occasions it’s broken through and we’ve had follow-through. Held through here through July, broke through, got a rally, and then saw one through here. So, that brings us to where we are now, retesting this resistance point.
And also, what we can do, we can add some Fibonacci retracements in of this whole decline from the August high. And that’s interesting when you do that because when we put those Fibonacci retracements on, we can see the 50% retracement of this entire decline comes in just above 3900, so just above where the market got to on the Thursday day session in the U.S. And another point of interest on this with where we are at the moment is skipping back to the daily chart. It’s also interesting to see where the moving averages are. So, let me just get rid of those Fib retracements. Just looking where the moving averages are, the 50-day and the 100-day. So, we’re right smack in the middle of where the moving averages are currently coming in. And what we find in a bull market is some moving averages often act as support, and they’re often a good opportunity to buy the dip. In a declining market, the opposite holds true. And it’s often a case of the price. When the price is below those moving averages, the moving averages often offer resistance. And that’s what seems to be happening here and now.
So, it’s probably not surprising. I don’t think it’s surprising that we’re seeing the S&P 500 just start to pause after this rally over the last two weeks we’ve had from the lows. So, we’ve essentially got a cluster of resistance points around current levels. So, this looks to me like a natural place for this rally to at least pause. But at this stage, I’m still looking at the potential of higher levels. And I think given the structure that we currently have in place, I think the potential of higher levels certainly exists, and we shouldn’t be sitting here now expecting we’re going to get this quick reversal back down to the lows. From the setups I’m seeing across the markets, I don’t think that’s a likely scenario in the near term. So, what I think is going to be important over the next week, it’s going to be important to see how this pullback develops.
So, let’s just go back to the four-hourly chart and talk about how that could develop. So, we’ve had this sell-off late on Thursday in the U.S., and that seemed to be around Amazon’s earnings coming out after the market had closed, falling short of expectations. So, the markets had a decline on that news. There were also some other tech disappointments during the week, so that’s tended to add on that weight to the market. You look at the NASDAQ. You see the NASDAQ has particularly struggled to make headway, it hasn’t gotten through a resistance band it’s approached, and it’s really lagging the key U.S. indices.
What I think is interesting just here is that the market seems to be absorbing bad news better than it has been over maybe the last several months. So, that’s somewhat of a positive sign seeing some results fall short of expectation and not have the whole market fall apart. It’s definitely a step forward on where we’ve been in recent times.
Now I think the first area to keep an eye on, to monitor how this pullback goes, the first area to keep an eye on will be the Fib retracements of this last leg of the advance. And that comes in just not too far from the low we saw during Thursday. Break below here wouldn’t invalidate any positive scenarios, but it would be good. I think the best-case scenario would be to see the market chop around sideways for several days and then have another test at this resistance. I think that’d be the best scenario to look out for. But we just need to see. We need to see whether the market can get this sideways base before having potentially another go at that resistance.
And just to be clear on all this, going back to the daily chart. Just to be clear on all this, I’m not saying that this is a final low by any stretch. I think it’s more than a short-term low, but whether it’s a final low or not, it’s just way too early for that. I think our default position has to be that this is still an active bear market. Nothing has happened to say the bear market is over. The moving averages are still trending lower, the price is still below the moving averages. We still have a down trendline. So, they’re the facts of the matter. Trying to call a final low now, it’s just premature to the extreme. But I think we have enough evidence at this stage to at least cautiously start having some exposure to the market and then seeing how these upward moves develop. Because it is entirely possible that we continue to see the market build towards this resistance point. Markets do bottom at some point. You never know. It seems like such an unlikely scenario to most people that a low could form here, but it could. So, that’s why whilst we have the momentum, we let the momentum go where it’s going to go and we continue to assess the strength of that momentum each week when we come back through these videos just seeing how it’s developing, how it’s playing out.
Now I want to show you why I think this rally could develop a little bit further in a moment. But first, if you’re getting some value from this, please hit that like button. Please leave a short comment, just “Hey, thanks for the video.” That’s all I need. It just tells YouTube people are engaging with the videos, and if people are engaging, YouTube shows more people. And that’s why I go to the effort to make these so people watch and I help people and, hopefully, people find interesting. And yes, if you could do that, it helps immensely.
And now let me just quickly show you why I think this rally might have a little bit more to it. So, this is a market breadth indicator which I’m using. I’ve got the S&P 500 up on top. It’s a weekly chart, goes back to 2008. And this here, this is showing the number of S&P 500 stocks that are trading above their 200-day moving average, so it’s quite a longer-term indicator. And what I’ve done here, you’ll see this blue line down the bottom. That represents 15% of stocks. So, when this indicator comes back and touches 15, it means only 15% of stocks are above their moving average. And that typically happens around low points.
Now the way I’m interpreting this current setup, my trigger for this is when the number of stocks below their 200-day moving average falls below 15, it can stay below 15 for some period of time and then turns back up and rises above 15. That’s the trigger point I use for assessing this. And it’s an interesting one because when we look back over the last 14 years, you can see that each time the indicator gets down here, breaks back above, it tends to coincide with some sort of a notable low on the market. We do get some false starts with this. Back here, for instance, in 2011, the market did breach the 15 point, it went up, and then it came back down. Something similar here. It was a double test of it. And we’ve also seen it here in August. It did get below, start the rally up. Did lead to that rally into the August high, so it was a notable rally. But what you tend to find is once the number of stocks above their 200-day moving average starts to get some momentum, it tends to extend. So, we have some momentum here. It’s going to be interesting to see where this goes. Can this continue to rise? If the number of stocks above their 200-day moving averages continues to trend upwards, it’s almost certainly going to lead to the higher levels in the S&P 500. So, it’s a really interesting one to watch.
And lastly, I just want to quickly show you one more graph. It’s the U.S. 10-year bond yield. Really interesting setup that we’ve got here. So, I’ve got the yield up on top, and down below, I’ve got a rate of change indicator. And this is a weekly chart. What stands out here is the degree of divergence we’re getting between the yield and the rate of change. It’s quite significant. And I think there’s now quite a reasonable possibility that this could mark at least an intermediate top in bond yields. So, way too early to say this is a final high, by any stretch, but just at least an interim top, and then we see what develops later in the future. Looking at divergence in the past on this indicator. I’ve just marked out a couple of points where it’s been useful in this falling yield environment. We got divergence which led to a turning point, and the same here, we got some divergence when the yield was rising, which led to a reversal.
So, just looking at this, even if we only got a pullback for this last leg, for this rally we’ve seen since August. Just putting some Fibonaccis on that. If the yields got back to…that comes down to around 3.5%. If yields were to pull back over the next potentially several months towards 3.5%, that would then be a tailwind for equities more than likely. So, it’s one of those things to watch.
The U.S. Dollar Index is also looking like maybe it’s made at least an interim high so, again, there’d be another positive for markets. So, I think these are all pieces of the puzzle and I think they suggest that we simply shouldn’t dismiss the latest rally in stocks as just being a short-term reprieve before another big sell-off. I think be cautious, be stock selective, but be open to the possibility that maybe this can tune into something else. And don’t be just steadfast locked into the most dire scenarios because most dire scenarios often don’t happen. So, keep an open mind, keep watching, and I look forward to coming back and talking to you next week.
Please see video for more details analysis and charts
Looking for the best ASX stocks to buy now?
Motion Trader‘s algorithms scan more than 2,000 ASX stocks daily in search of medium term investment trends. We then tell our members precisely when to buy shares. And most importantly, we tell them when to sell.
Try a no obligation FREE 14-day trial of Motion Trader, and see what an algorithmic trading approach could do for you.
Meet Jason

I'm Jason McIntosh, the creator of Motion Trader. My career began in 1991 on the trading floor at Bankers Trust. Nowadays, I trade my own systems from home in Sydney.
Motion Trader is for investors who value robust analysis, data driven entry and exit signals, commentary, and education. I use engineered algorithms to identify when to buy and sell ASX stocks. No biases or guesswork, just data driven signals.