SP500 Has NEVER Seen Such An Extreme | Episode 50
By Jason McIntosh | Published 15 July 2022
Trade the Trend is a weekly video focusing on where the stock market is going. It’s for investors and traders looking for insights to the market’s next move. Jason uses technical analysis of stocks and trend following techniques to help you piece together the world’s biggest puzzle.
Where is the Stock Market Going?
00:00 Intro
00:29 SP500 is brushing off bad news
02:10 Watch these levels in the SP500
04:50 SP500 could be forming a base
06:34 Could this spark an explosive rally? (Must see graph!)
09:58 This key part of the puzzle might be in place
12:47 How should you play this?
Transcript (abridged)
Please note: Charts available from video
The price action in the S&P 500 is fascinating. We now have a market that isn’t reacting to bad news. And the big news this week was U.S. inflation. It came out at a 41-year high of 9.1%. That’s more than the economists were expecting. They had expectations of around 8.8%. So, it really was a very high number.
It interesting to look at the hourly chart around the time of the announcement. The S&P 500 had an initial selloff on the inflation news, then rallied back. There was another attempt on Thursday to sell off. But again, the market rallied back.
Another interesting development speculation about a 1% rate rise at the Fed’s next meeting. The market had a big catalyst to sell off aggressively, but it didn’t. That gives weight to the possibility that everyone who wants to sell has already sold, at least temporarily. And it potentially takes the downside momentum out of this market.
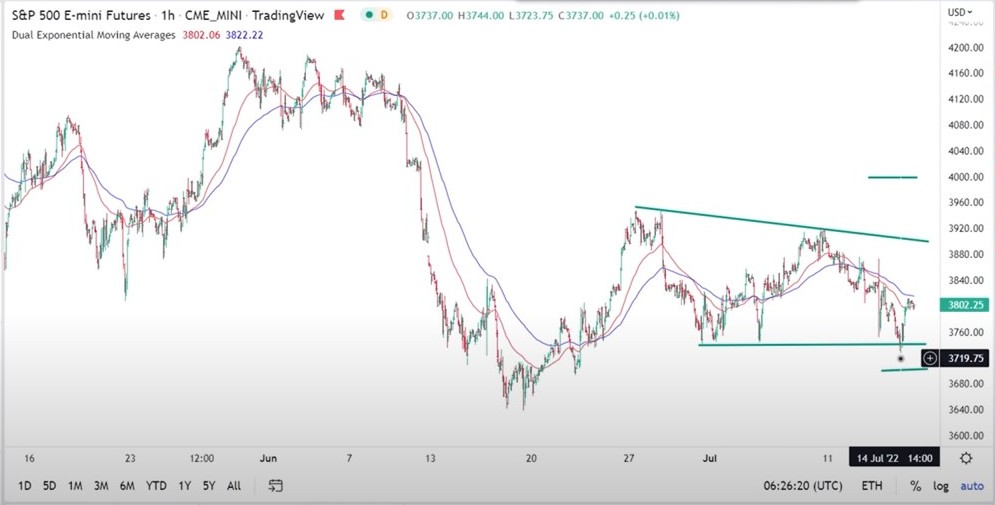
I want to focus the clearly defined trading range that has formed. It’s between 3,740 and 3,900. The S&P 500 attempted to break down on Thursday. But there wasn’t any follow through selling when it broke through support. It’s encouraging that the break didn’t lead to further selling. In fact, the S&P reversed those loses and rallied back.
I think there is still downside risk to this market. If the S&P 500 breaks below Thursday’s low at 3,723, and then breaks 3,700, I think we go back on red alert for a big down sequence where the S&P 500 could lose 200 or 300 points over the course of a week. I think that downside is risk still exists and could reengage.
On the upside, now this range is a little bit more defined. We can say that an upside breakout starts happening around $3,900, $3,920. That could trigger a new round of buying and it could potentially see some short covering start to come into the market, and that could push prices higher.
Just coming back to the daily chart. I think the longer the market stays within a tight range, the odds for a sharp decline diminish, and I think the greater the potential that this becomes a basing pattern. Now I want to stress that I think it’s too early to try calling a final low. The S&P 500 remains well below the 50 and 100-day moving averages. You’ve got to say the primary trend is still down and the macro outlook remains awful. You look at the interest rate cycle, you look at inflation, you look at the war in Ukraine. It’s a really difficult macro environment.
Against that, we also need to remember that bear markets also have rallies. Bear markets aren’t just about stocks falling in a straight line. Bear markets also have rallies. And, in fact, some of the strongest rallies are within bear markets. And so what I’m thinking is maybe that the S&P 500 is currently setting itself up for a classic bear market rally.
I want to show you a fascinating chart that I saw through the week. It hints that the bear market rally scenario could be the one that we need to watch for. This chart turned up in my Twitter feed through the week (see video). I think it’s just fascinating. What it’s shows is the amount of money going into inverse ETFs. An inverse ETF is an ETF you buy when you think the market is going to fall. When you buy an inverse ETF, the price goes up when the market falls.
There’s currently a lot of money flowing in inverse ETFs. In fact, $9.8 billion is sitting in inverse ETFs. That’s a lot of money which is betting on another selloff. And it’s more so than during the COVID crash, which got to $8.5 billion.
It’s also interesting to note how quickly the funds in inverse ETFs has been rising in the last month. People have been selling the rally. Now, this doesn’t mean there’s a final low in place by any stretch. But it does make me wonder if all this short interest and negativity is a sign that a bear market rally is close at hand.
I think another key piece to this puzzle is the U.S. dollar. It’s interesting to see that the previous bear market rallies have coincided with the US dollar index moving sideways or pulling back. And all the falls over the last few months have coincided with the dollar index rallying.
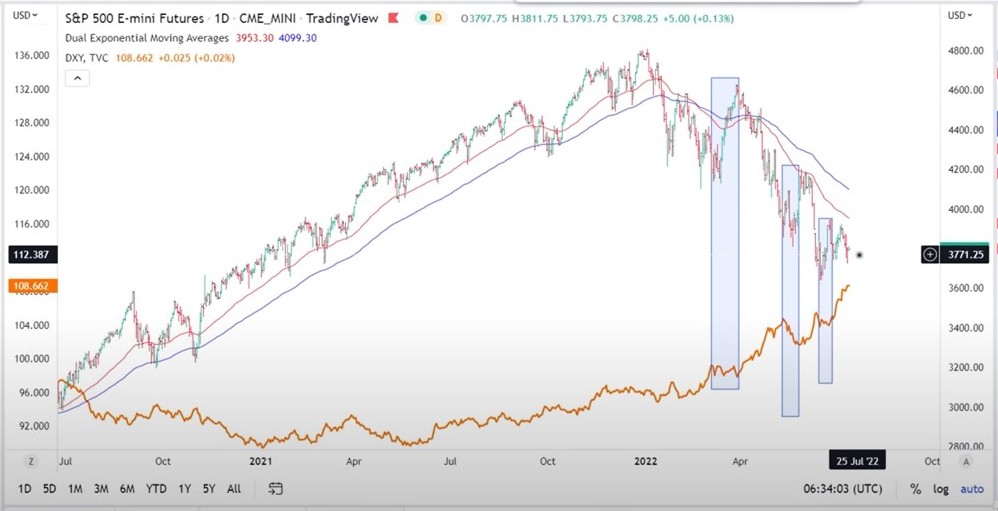
What’s been interesting in the last few weeks, is the dollar index has been having a strong run. But the S&P 500 hasn’t been selling off like it has previously. Rather, it’s been holding its ground. And so that gets back to my point from earlier on. The market now seems to be brushing off bad news. It’s brushing off higher inflation. It’s brushing off the potential for larger interest rate raises. And it’s brushing off a rising U.S. dollar.
Does this mean it’s becoming resistant to falling right at the time when there’s maximum exposure to inverse ETFs? All those puzzle pieces suggest to me that the possibility of a bear market rally really is coming into play.
And I wonder what would happen if the dollar, which does seem to be losing a little bit of its momentum, I wonder what would happen if the dollar started to pull back or even if it just started to go sideways? Would that be enough to trigger some of the shorts, and some of the inverse ETF holdings, to start to cover. And could that drive a bear market rally?
I think the potential is there. I don’t know whether that’s going to happen. But that’s one of the things which I’m thinking… one of the things I’m looking at.
So what do you do as an investor? How do you handle this as an investor? And as I keep saying each week, I think we need to continue playing defense. I think defense is the name of the game in this market. Yes, there are signs there could be a rally. But I think we need to remain cautious, because bear market rallies can draw you in and they can reverse course quickly.
And I’d think twice about having too much exposure to inverse ETFs. Inverse ETFs can seem like a good idea. But the problem is they can be a costly product when the market moves against you. And bear markets are just notoriously difficult to navigate. If I had inverse ETF exposure, I’d maybe think about lightening that up.
It’s going to be an interesting to see how this plays out. The market is at a pivotal point. We’ve got resistance and support on both sides. It’s really pinning in now. We’re going to get a break one way or the other, and I think the market is going to move quickly when it breaks. So let’s hold on and see what happens.
Looking for the best ASX stocks to buy now?
Motion Trader‘s algorithms scan more than 2,000 ASX stocks daily in search of medium term investment trends. We then tell our members precisely when to buy shares. And most importantly, we tell them when to sell.
Try a no obligation FREE 14-day trial of Motion Trader, and see what an algorithmic trading approach could do for you.
Meet Jason

I'm Jason McIntosh, the creator of Motion Trader. My career began in 1991 on the trading floor at Bankers Trust. Nowadays, I trade my own systems from home in Sydney.
Motion Trader is for investors who value robust analysis, data driven entry and exit signals, commentary, and education. I use engineered algorithms to identify when to buy and sell ASX stocks. No biases or guesswork, just data driven signals.