SP500: FOMO Turns to Fear | Episode 65
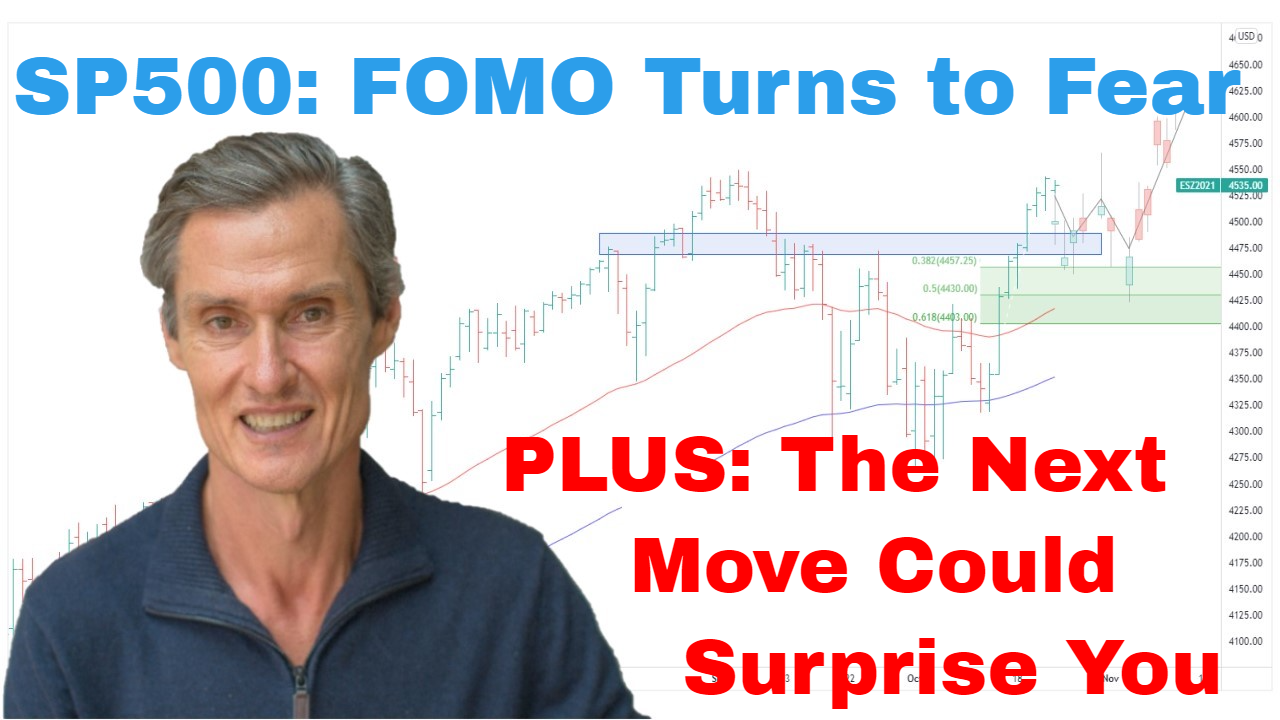
Where is the Stock Market Heading?
00:00 Intro
00:28 FOMO turns to fear (what this classic price action means)
02:45 Why you should be aware of the price action
04:12 Here are 3 reasons to be concerned about the SP500
07:01 Watch this key level for SP500
10:17 What I think the SP500 is about to do (it may surprise you)
Transcript (abridged)
Please note: Charts available from video
Let’s start with a chart of the S&P 500. It’s amazing how much has changed in a couple of weeks. Just two weeks ago I talking about how I was seeing signs of FOMO coming into the market, or fear of missing out. People were seeing the SP500 rally and thinking we could get a re-run of the March 2020 lows. But what we have now after a couple of weeks of pullback is bearishness really coming back into the market, and people are talking about an almost imminent retest and break of the June low.
I can completely understand why there’s so much anxiety around this market because it’s been such a whip-soaring market pretty much for the whole year since January. We’ve had three double-digit rallies in March, May, and then through June/July. So, three double-digit rallies, and we’ve had two double-digit declines. And the latest decline is just shy of 10%. So, we’ve almost had three double dig declines.
This is classic price action that you see in and around bear markets. It’s volatile, and it creates a whole lot of emotion. And people see prices rising and they think, “I don’t want to miss out,” and they rush in and buy, and then they see these prices that quickly reverse. And then that brings in all the fear and people start rushing to inverse ETFs and selling their stocks.
So, it really is a difficult environment, and it’s just such a different environment to the established upward trends that we often get in stock markets, where you get more consistent price action and it’s a lot more straightforward in entering and running your profits and making money. This is anything but straightforward for pretty much everyone. But if you study the price action, you can still at least be aware of some of the possibilities of how these periods can play out.
A couple of weeks ago, I was talking about the potential for a retest of the moving averages because that’s quite a common occurrence. Once the market’s below the moving averages and it rallies back up, crosses the moving averages, even if it’s going to develop into a bullish trend over multiple months, you often get a retest of those moving averages. And that’s what we’ve seen over the last couple of weeks. So, we’ve now had that pullback. It’s now a case of what next? What are we going to get next? Is it going to be a case of this period through here in March where the market got above the moving averages and then turned and rolled down to new lows? Or is it going to be more of a new upward sequence that does see the market hold its footing here and start to move up to a high above what we saw in August?
Let’s do some analysis on this chart and try and piece together how this could play out. So, I think we’ve got to say that the primary trend remains down. We don’t have enough evidence. We’ve got some potential positive developments in the last few weeks in that the S&P 500 has broken above a previous high point for the first time this year. And that was confirmed by the Dow and the NASDAQ and the Russell as well. So, that’s a potential positive. But overall, that dominant trend, primary trend remains down until proven otherwise.
We’ve got the moving averages. On this chart, I’ve got the 50 and 100-day moving averages. They remain negative. They did start to turn higher during this rally, recent rally. They haven’t crossed, and they look to be turning down again. So, at this point, we’ve got to say the moving averages remain negative. And with the price currently below the moving averages, that’s always a point of vulnerability. That’s when a market…As I often say, the bad stuff typically happens below the moving averages. So, with the S&P 500 below those averages, it does open that window of negativity where you can get some selling activity really starting to develop and possibly intensify.
And the other thing of note is we now have a three-point trendline, a down trendline that we can draw above the market. So, I like three-point trendlines. I don’t like two-point trendlines. You see, with a three-point trendline, I think that gives you something significant to reference off. So often I see people drawing two-point trendlines. For instance, let’s say we were to use this significant point here. People would be drawing trendlines. They’d get that low and draw a trendline, and then they might get this low and draw a trendline. And you can see they don’t actually offer a great deal of value unless a two-point trendline is coupled with a trend channel. You get the lower line and then you got an upper line. So, you actually do get a trend channel through there.
I prefer to look for three-point trendlines. I think they’re more significant. They’re more meaningful. So, this will be useful if and when it breaks to give some indication that the market is gaining upward momentum. But we’re a long way from that yet. The market hasn’t done so, and so at the moment, we’ve got that down trendline. So, they’re all reasons to be cautious. So, moving averages, downward trendline, reasons to be cautious.
And where we are now, this is actually somewhat of a key level because the S&P…we’ve had the large rally and we’ve had the pullback. And I think if we’re going to get another leg higher, we really need to see the buyers stepping in around where we currently are and starting to buy this dip. Because what we can also do, we can put some Fibonacci retracements on and measure this leg of the advance. We’ve actually dipped below the 61.8%. We’re currently just hovering right around there. So, this is really as far back as we want this to come to give this the benefit of the doubt of potentially being a new upward sequence. Whether or not it’s a new bull market, that’s another thing altogether, but whether it’s even just another upward sequence, it gets us back up towards potentially around 4,600 or maybe a little bit higher. But this is such a key point. The market does need to hold around here.
From a bullish standpoint, I think what we’d ideally want to be seen…We can just sketch some possibilities in. From a bullish standpoint, you’d really want to see quite a strong, quite a healthy rebound off this low, then opens up the potential of consolidation before a punch through that trendline and a new high above where we were in August. That’s the bullish case. That’s the price action you’d want to see if we’re going to see some new round of buying come in. We need to see those buyers actively buying this dip. And then that sets up that possibility of consolidation and a punch through.
On the bearish side, what we don’t really want to see is the market forming some maybe wedging pattern and then starting to roll down from there, or potentially just continuing to sell off now. So, the old dead cat bounce, sideways movement, and roll over, that would be the bearish price action. That’s what to look out for on the sell side. And that could open up another sell sequence. So, it’s really important, I think, where we are now. We’ve got to just watch how this price action develops because I don’t know, no one knows which way this is going to swing. We can have a favorite view, which I’ll tell you about in a moment, but we really need to watch this price action.
Now, let me just briefly tell you my favoured view. I think we’re going to bounce from these levels. I’ll quickly jump over to an hourly chart. Okay. So, just looking at this hourly chart, what I can do here…This is getting quite fine when we jump to the hourly chart. This is the thing I’d do if I was trading S&P futures maybe on an intra-day or short-term basis. I’d look for patterns like these in the hourly. We’ve got this descending…this bullish wedge which formed over the last couple of days on the hourly chart. We’ve got this punch off above it last night. So, that gives the market some potential to rally from here to start that bouncing process.
It’s also interesting. This is just last night, this period here. The market opened lower, traded down, and then towards this latter half of the day, we had a strong rally. That’s a slight positive in itself. So, these are all things that could add into getting a larger bounce developing.
And also, the other thing I think to keep in mind is we can’t ignore what I showed you last week. If you watched last week, this is the S&P 500. Below here is an indicator showing the number of stocks or percentage of stocks above their 50-day moving average. When this indicator hits 90% during periods where the market’s rebounding from a significant low, as you can see these where I’ve got these blue shaded areas, it’s called a breadth thrust. So, that means there’s a high amount of participation in the S&P 500 base of stocks participating in the rally. And that’s what we got in this recent rally. It was a large number of stocks participating in the rally.
I explained this more in last week’s video. So, jump back and have a look at that if you didn’t see it. But it’s another reason why I think we can’t ignore the possibility that this market does try to push higher. I also think the level of bearishness is high. Lots of people are expecting an imminent breakdown to a new low. And in my experience, bear markets, they often just don’t deliver what people are expecting, and rather they inflict pain, they cause confusion. And this whole six-month period or nine-month period, it’s just no different. It’s just a really difficult period.
My approach over the last six weeks from around here has been to incrementally get some exposure to the market. If this market does turn and keep rallying, at least that means I’ve got a base position which I can keep building on. If it does happen to roll over here and continue to a new low, I haven’t done too much damage. So, I’m trying to have a foot in both camps because it’s all trying to manage risk.
I know people like to be told what will happen but, no one can do that. Well, at least they can’t do that, honestly, because we just don’t know. The best we can do is prepare for the possibilities. We manage our risk. And I think the play here and now is wait and see. If you’ve been incrementally adding to your positions, wait and see what happens. If you don’t have positions, again, wait and see. I don’t think there’s a hurry to do anything new now. I think we want to wait and see how this pullback develops, what happens probably over the next week, in particular.
Please see video for more details analysis and charts
Looking for the best ASX stocks to buy now?
Motion Trader‘s algorithms scan more than 2,000 ASX stocks daily in search of medium term investment trends. We then tell our members precisely when to buy shares. And most importantly, we tell them when to sell.
Try a no obligation FREE 14-day trial of Motion Trader, and see what an algorithmic trading approach could do for you.
Meet Jason

I'm Jason McIntosh, the creator of Motion Trader. My career began in 1991 on the trading floor at Bankers Trust. Nowadays, I trade my own systems from home in Sydney.
Motion Trader is for investors who value robust analysis, data driven entry and exit signals, commentary, and education. I use engineered algorithms to identify when to buy and sell ASX stocks. No biases or guesswork, just data driven signals.