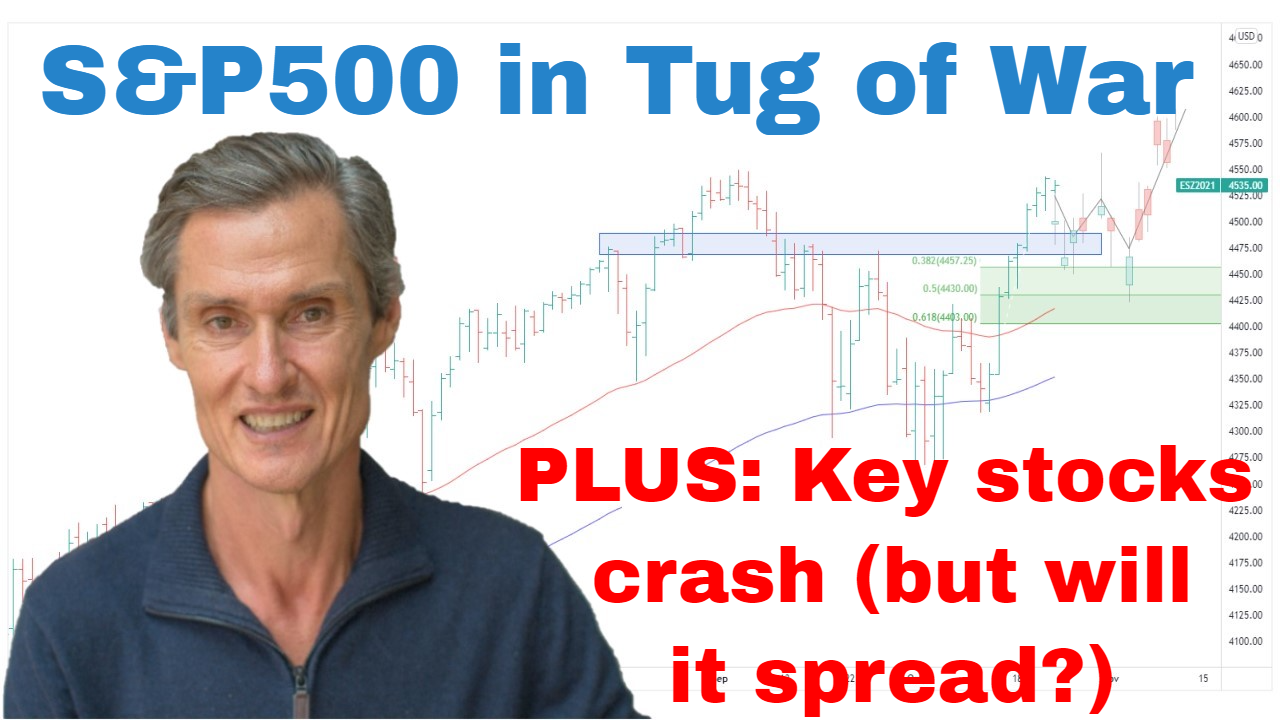
SP500 Caught In Epic Tug of War | Episode 83
Where is the Stock Market Heading?
00:00 Intro
00:33 Key resistance cluster repels SP 500
05:06 Where does the SP 500 go from here (these are the facts)
06:24 An epic tug of war is playing out in these indices
09:40 These key stocks are crashing now (but will it spread)
Transcript
Please note: Charts available from video
Let’s start with the S&P 500. It’s been an interesting week in the market. The S&P 500 stalled right at the cluster of resistance points that we were talking about last week, and the catalyst for that fall was, of course, we had the rate hike announcement and also hawkish comments from Fed Governor Powell.
So, let’s go over to the four-hourly chart and just get a little bit more detail on this price action. So, it was interesting to see the market last week rally towards the Fed announcement. So, this is the market last Friday, the Friday session for the S&P 500. We got the market rallied on Friday, continued to try and rally early last week, and then it’s fallen away, and the fall’s accelerated after the rate announcement. So, this resistance region that we have here between…it’s around 3900 and 3950. That was always and remains a…It’s a tough one to crack. It’s a tough resistance band to crack because when we look at how this has performed since…We can really go back to around May, and you can see how technically active this region has been in that it’s supported the market on various occasions, caused the market to react back in the opposite direction, and then when it breaks, it tends to follow through. And you can see these points as we move through the year. And here we have another point where it’s tested and it’s now rejected. So, it really has been an area of importance for the market.
I said last week that I thought the best-case scenario was going to be some maybe sideways trading and some sort of a pause, and then from there, maybe an attempt to punch higher. We didn’t get this sideways trading, instead, we got a quick move up into the resistance. Now the significance of a pause, what makes a pause interesting when they happen is that it helps the market build up energy to then have an attempt at pushing and punching through resistance. But that’s not what we got. The market just ran out of steam. It had a thrust in the resistance area but there was no follow-through. It didn’t have that pent-up energy to push through, and now we find it back down here back below that resistance. And just adding to this resistance band, and I’d shown you this previously…I showed you this last week. It’s the Fibonaccis. They’re always interesting to look at these Fibonacci retracements because you can see that this reaction down from resistance also coincided with that 50% Fibonacci retracement. And so yeah, the resistance has done its job. It’s resisted the market’s advance.
So, just going back to the daily chart. And the other thing we’d note is that we’ve got the 50-day moving average coming through, and the market got right to that 50-day moving average as well, so we had those 3 resistance points that were reacted down from. And moving averages are interesting. Someone left a comment last week saying, “Why would you expect moving averages to provide any resistance or worse to that effect?” And the thing with moving averages is if you’re looking at things like the 50, the 100, and the 200-day moving averages, they’re the moving averages which a lot of traders and investors look at. And if a lot of people look at them, well, then they really can have an impact on the psyche of the market and how the market responds when it hits or goes through or bounces off, whatever it may be. They’re important levels to be aware of. And so that’s why I’m always focusing on moving averages. Shorter-term averages can also be useful if you’re a short-term trader or swing trader. But for me, it’s averages like the 50, 100, and 200-day.
So, where to from here? Well, quite simply, I think we need to be cautious and I think we need to be defensive. The facts as they stand today is we still have downtrend. We have an intact downtrend in place. The S&P 500’s price is below the moving averages. The moving averages are trending lower. And we’ve just had the Fed tell us that they’re not backing off their aggressive rate hike agenda. So, none of that is bullish. It’s not bullish at all. But that said, when I look at this price action of the S&P 500, it doesn’t look to me that it’s set up for a crash, and that’s a concern of so many people that the market is about to crash. This isn’t, from my experience at least, not a crash setup.
There’s also the matter of these midterm elections. Now, these have historically been supportive for markets, so I don’t think it’s simply a case of a one-way negative story. There are other parts of this story which we need to consider and we need to take on board. And looking at the indices, it’s like, to me, going through all the indices like the Dow, we’ve got the NASDAQ, S&P, we’ve got the Russell., it’s like we’ve got two parts of the market battling for control.
So, we’ve talked about the S&P 500. Let’s have a look at another index. Let’s look at the Dow, which I often don’t bring up in our videos. But the Dow is really interesting because, yes, it’s still in an overall downtrend, but to me, it looks like it’s trying to base because every time it comes down, it then rallies sharply. Now, bear market rallies can be sharp, but the intensity of these rallies, it’s resisting going down is the point. So, it’s a market which looks like it wants to turn higher. It’s back above the 50-day moving average, was briefly above the 100-day moving average. It could be in the process of trying to form a bottom. It could be a bottoming process. It could still take time, but it doesn’t look like at this point in time that it’s set up for a new low. It just doesn’t look like it’s set up that way. So, it’s hard to get a market crash when a big segment of the market doesn’t look like it’s set up for new lows.
On the other hand, we’ve got the NASDAQ. Now, this is another story all together because this is an ugly-looking sharp. There’s no two ways about it. It couldn’t get above this resistance band, this resistance between around…it’s around 11,500. It’s not even a heavy overhead resistance band but we had this rally over the last month or so and it couldn’t get into it at all. And then when we look at the Fibonacci retracements from this August high, and it only got to the lower end of the Fibonaccis where you’ll remember the S&P 500 got to the 50% and the Dow has sailed well above the Fibonaccis altogether. So, it’s a weak-looking market, and it’s a market that looks like it’s going lower. The trend is down, and there’s nothing on this chart which suggests that we should be positioning for a turn. The price is well below these moving averages. The moving averages don’t even look like they’re trying to turn. It’s a bearish chart for the tech sector, which is a significant part of the overall market.
Now if you’re getting some value from these videos, please hit that like button. Really important. Please do that for me. And also, please leave a short comment, just “Hey, thanks for the video.” It’ll tell YouTube you’re watching, it tells YouTube you’re engaging, then YouTube shows more people. And that helps what I do so much because it’s taken a long time to put this together and record and upload. And also, please do that. It helps me a heap. And also, come and visit me over at motiontrader.com.au and see what else that I do.
Now, just talking about the tech sector some more, just want to have a look at some of the big names in tech and some of the recent price action. So, here’s Microsoft. Now what’s interesting with this, obviously, we’re in a downtrend. Moving averages are lower. Look how far below the moving averages this price is. It really is falling away. It’s just making new lows now. And just in the last week-and-a-half, Microsoft is down 15%. So, this is a big move, and this is an ugly chart, just like the NASDAQ, and it’s one of the biggest components in the overall market.
Looking across to Alphabet, otherwise known as, aka, Google. And it’s the same picture below those moving averages, moving averages trending down, and the price is just dropping away. It’s actually down around 20% in the last week-and-a-half. So, if the overall market was down 20% in the last week-and-a-half, we’ll be saying it’s a crash. So, Alphabet is essentially crashing. So, these are some of the biggest stocks in the market and they’re under a huge amount of pressure. Apple is doing a bit better. Then you look at Meta and it’s doing a whole lot worse. So, this hasn’t spilled over to the broader market at this point, but while this sell-off is underway in these giant tech names, we need to tread carefully because is there going to be a contagion event where it spreads? It could happen. I don’t see it in the setup and the S&P 500, in the Dow, but you can never rule that out.
So, going back to our S&P 500 chart. I’ve still got a modest long position which I put on after this CPI day reversal. Continue to hold it. I don’t have the trigger to exit just yet. I went through my reasoning for that position last week, so if you miss it, have a look at last week’s video. And when I look at the Dow and I look at the S&P 500, still think it’s possible that this is still part of a bottoming process underway. So, I don’t want to then now lurch over to the most bearish and dire scenarios because we’ve had a rate hike and a bad week. Still got to be open-minded that different things can happen. We’ve got to look at the price action. We respond to the price action, not the fears. And that said, the latest breakdown in big tech is concerning. I think we have to respect the trend is down. We just have to be patient, and we need to protect our capital. And we just got to wait for the price action to tell us when the time is right to put on more risk. And that time is just not at the moment.
Please see video for more details analysis and charts
Looking for the best ASX stocks to buy now?
Motion Trader‘s algorithms scan more than 2,000 ASX stocks daily in search of medium term investment trends. We then tell our members precisely when to buy shares. And most importantly, we tell them when to sell.
Try a no obligation FREE 14-day trial of Motion Trader, and see what an algorithmic trading approach could do for you.
Meet Jason

I'm Jason McIntosh, the creator of Motion Trader. My career began in 1991 on the trading floor at Bankers Trust. Nowadays, I trade my own systems from home in Sydney.
Motion Trader is for investors who value robust analysis, data driven entry and exit signals, commentary, and education. I use engineered algorithms to identify when to buy and sell ASX stocks. No biases or guesswork, just data driven signals.