SP500 Bears Return | Last Chance To Sell? | Episode 108
Where is the Stock Market Heading?
00:00 Intro
00:34 Are the SP500 bears returning?
01:42 This is your job as an investor (many people fail)
03:33 Look for this over the next 2 weeks
05:58 Watch for this classic chart pattern in the Dow
08:20 Keep an eye on this key market (it’s a big piece of the puzzle)
09:09 Highly significant price action in the Nasdaq
Transcript
Please note: Charts available from video
This video is going to focus on the S&P 500. I’m going to cover the ASX 200, gold, copper, and uranium in a separate video, and I’ll leave a link for that in the description section below. I’m also going to show you a big development in the NASDAQ, so make sure you stick around for that. As always, this is general commentary and doesn’t take your personal situation into account. With all of that said, let’s get into our first chart.
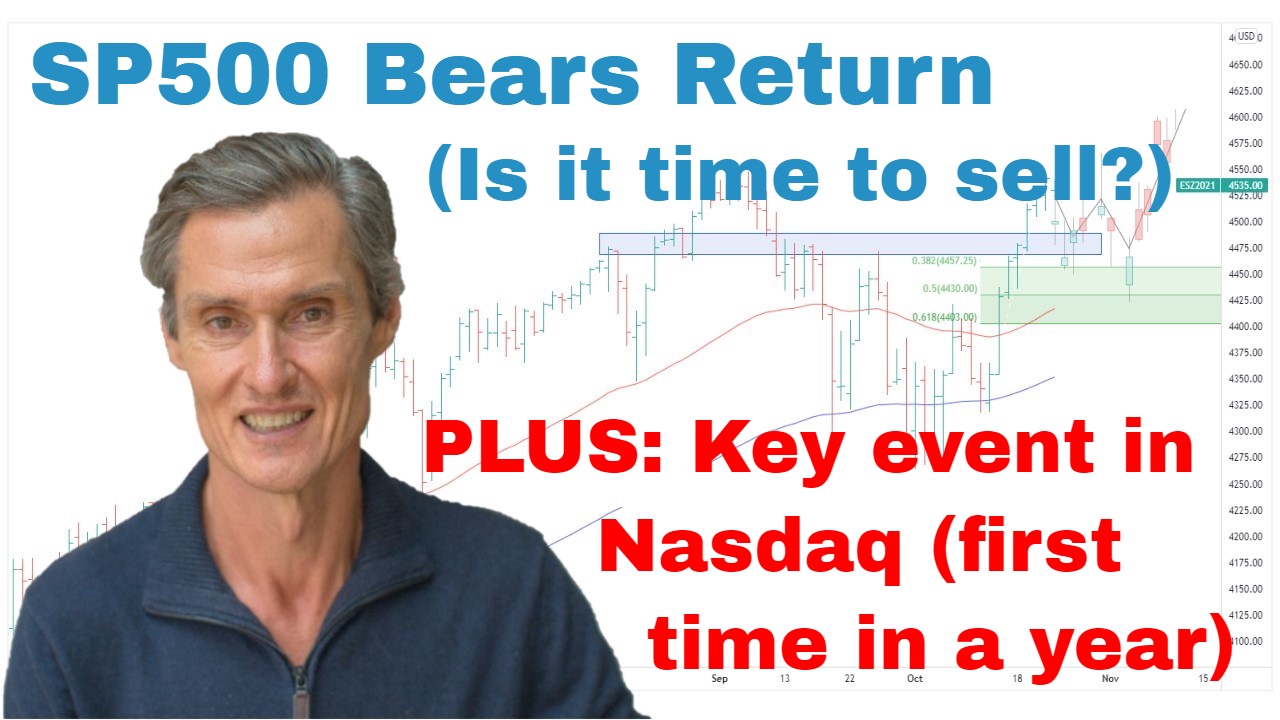
So, we’ve got the S&P 500 up on the screen. And the big question which I think a lot of people are asking is, is the bear market returning? And we saw the S&P 500 fall 2% in just 5 hours on Thursday. So, I think that gives the bears…probably gives them a bit of encouragement. And they haven’t had a lot of encouragement over the last couple of months. So, that’s something the bears are starting to talk about, is this the start of the next wave down? But I’ve got to say straight off the bat I think it’s too early to be getting bearish after a down day. And there’s always going to be swift pullbacks in any upward move. And we can see them. They’ve occurred several times over the last few months. You get these swift down days. Even going back here into December you can get a swift down period but doesn’t mean the whole market is rolling over and heading to new lows. Our job as investors is to… We need to assess these pullbacks as they occur, and we need to determine if they changed the underlying trend. That’s the key. Does a down day change the underlying trend? And at this stage, I would have to say that, from my perspective, I think price action continues to favor the bullish side.
So, let’s go through the facts as we have them. I’m going to put some moving averages on, go through this. So, these are the facts at least as I see them. So, at the moment, we’ll go up, the S&P 500 is trading above the moving averages. So, I’m using 50 and 100-day moving averages on this chart. And the moving averages are trending higher, so the 50-day has crossed above the 100-day. So, those two factors, they’re key underpinnings of a bullish chart structure. And we can also see that the S&P 500, a couple of weeks ago hit a 5-month high, the highest level since around August last year. So, the way I’m looking at this, I think the odds continue to favor that the path of least resistance is on the upside. So, what am I doing? Well, I’m maintaining my long positions in the market. I’ve got S&P 500 long positions, I’ve got long positions in ASX stocks. Nothing has happened over the last week to change my positioning within the market.
And I think the next week or two is going to be quite important. So, are we going to see buyers start to step up and support this pullback that we’re currently seeing? And I think that’s going to tell us a lot about the prospects over the next couple of months. And the pullback that we’re seeing at the moment really shouldn’t come as any terrific surprise because it’s a possibility that we’ve been discussing over the last week or two, in that the S&P 500 had gotten quite stretched above these moving averages. Some sort of a pause in that trend was…well, it was approaching. We knew it was happening at some point. Always a matter of when it was going to happen. But pauses and consolidations are a normal part of any upward cycle.
And just to be clear on all this, I’m not a rusted-on bull by any stretch. I’m happy to flip my thinking towards the market as the price action changes. So, if, for instance, we see that over the next couple of weeks, so the S&P 500 makes its way back down below this support area around 3900, gets below the moving averages, I’ll be saying, “This market is now looking vulnerable. We need to be prepared for another leg down.” But until that happens, I’m going to play this from the long side. I’m going to play it from where I see the path of least resistance until the price action tells me otherwise.
So, hopefully, you’re watching these videos each week, not to get a pep talk for the bulls or not to get a weekly dose of negativity for the bears. I’m just calling the plays as I see them, and I’m going to get them wrong from time to time. I’ll get them wrong probably quite a bit of the time. That’s why we use risk management strategies. When we’re right, we let our winners continue to run, and when we are wrong, we use risk management strategies to cut our positions or reverse our course.
And now if you’re getting some value from this, please hit that like button, and also leave a short comment, just “Hey, thanks for the video.” It just tells YouTube people are watching, people are engaging, and YouTube will show more people. And hit that subscribe button if you haven’t already. Another great signal to YouTube, and it helps me heaps. Please do those things. Like, comment, subscribe.
All right. Let’s go and have a look at another market. Let’s have a look at the Dow. Dow is interesting. I don’t think we’ve looked at this for a few weeks. So, capped at resistance. So, this is a resistance band around 34,000 and 34,400. Big band. Goes back to around April 2021. It’s not precise, as you can see through here, but it’s a general band of support resistance. And it’s done a good job at capping the Dow’s advance, well, since this October low. It’s been the capping point so far and has kept the market in check over the last few weeks. Now, the positive of this is that the Dow has been holding above these moving averages, so 50 and 100-day moving averages over the last few weeks.
And also, I’ve got the Fibonacci retracements on. So, that’s just mapping out from the October low through to the high in December. So far, we’ve seen the market come back to the upper end of the Fibonacci range, but I wouldn’t be surprised if we saw another retest of the Fibonaccis, and maybe we end up with some sort of a corrective sequence in the Dow where we have the classic A, B, C zigzag, which, of course, would entail another trip lower. Maybe that ties in with pullback we’re currently getting in the S&P 500. We don’t know. We’re just looking at possibilities, and that’s certainly a possibility that we could get that retest of the Fibs.
But at this stage, when I look at this chart, this run-up from the October low, that looks impulsive. By impulsive I mean we have strong moves up, we have shallow consolidations, and then we have runs higher. It’s not overlapping. It’s just big sweeping upward advance. And the move since November is quite corrective-looking. It’s overlapping the structure of this move. You can see that the lows and the highs, they just overlap one another. That’s a telltale sign of a corrective move. So, I think that’s another reason why I think it’s worth maintaining that upward bias to U.S. markets.
And just before I quickly move to the NASDAQ, one thing to keep an eye on over the next few weeks, just keep an eye on the U.S. 10-year bond yield. I haven’t been talking about this much lately because there hasn’t been much to say, but there is a wedging formation. Looking at the yield. So, on the yield, this is a bullish wedge, but a breakout of this would see higher yields. So, I think maybe this all ties together. Maybe this is where we’re going to see some sort of a pause in this advance we’ve been getting in the markets. Maybe we see some sort of an upward-moving yield. Keep an eye on this bond yield. Just see where that goes over the next… See if this pattern does break to the top side, and then keep an eye on those yields.
Now, let’s just go back to equities. I’m going to go over, just wrap up with a quick look at the NASDAQ. So, last week, you may remember we were talking about the possibility of a pullback. We had a situation where the NASDAQ was up 20%. It was getting quite stretched above these moving averages, so again the 50 and the 100-day moving averages. And it’s just normal for markets to pause and for rallies to be checked. And that seems to be what’s occurring now. We’re getting that pullback. But for me, the most significant development in the NASDAQ this week… If I just expand this chart up a bit, look at this, look at these moving averages. Fifty-day moving average has now crossed above the 100-day moving average. And that hasn’t happened. We haven’t had a situation where the 50-day has been rising above the 100, since you’ve got to go back here to around December 2021.
So, this is a bit of a development. I think this is a positive for the market. It doesn’t guarantee that prices are going to keep rising but I think it’s another tick for the scenario that we have the potential for seeing more upside over the coming months, that this move from the October low does have more to run, notwithstanding I think the likelihood of some consolidation maybe over the next few weeks, maybe over the next month. We just need to see how this develops.
So, as I’ve been saying over the last several months now, let’s see where this momentum in the markets, generally, let’s see where it takes us. I think the odds favor the path of least resistance remains to the upside, meanwhile we have indices trading above their moving averages. The key now is, are we going to see buying emerge on this pullback? Is this going to be a buy-the-dip moment? And this is critical to this bullish potential over the next several months. We want to see strong stocks hold their ground and move sideways to moderately lower, and we want to see accumulation coming into the market.
So, let’s leave it there for this week. Hopefully, that’s been interesting. I hope it gives you a few ideas a bit of a gauge on where the market currently is. I look forward to coming back and talking to you next week. Please give me that like. Until then, see you next week.
Please see video for more details analysis and charts
Looking for the best ASX stocks to buy now?
Motion Trader‘s algorithms scan more than 2,000 ASX stocks daily in search of medium term investment trends. We then tell our members precisely when to buy shares. And most importantly, we tell them when to sell.
Try a no obligation FREE 14-day trial of Motion Trader, and see what an algorithmic trading approach could do for you.
Meet Jason

I'm Jason McIntosh, the creator of Motion Trader. My career began in 1991 on the trading floor at Bankers Trust. Nowadays, I trade my own systems from home in Sydney.
Motion Trader is for investors who value robust analysis, data driven entry and exit signals, commentary, and education. I use engineered algorithms to identify when to buy and sell ASX stocks. No biases or guesswork, just data driven signals.