SP500 Bears In Trouble | Episode 106
Where is the Stock Market Heading?
00:00 Intro
00:39 SP500 has 3 big developments (what it means next)
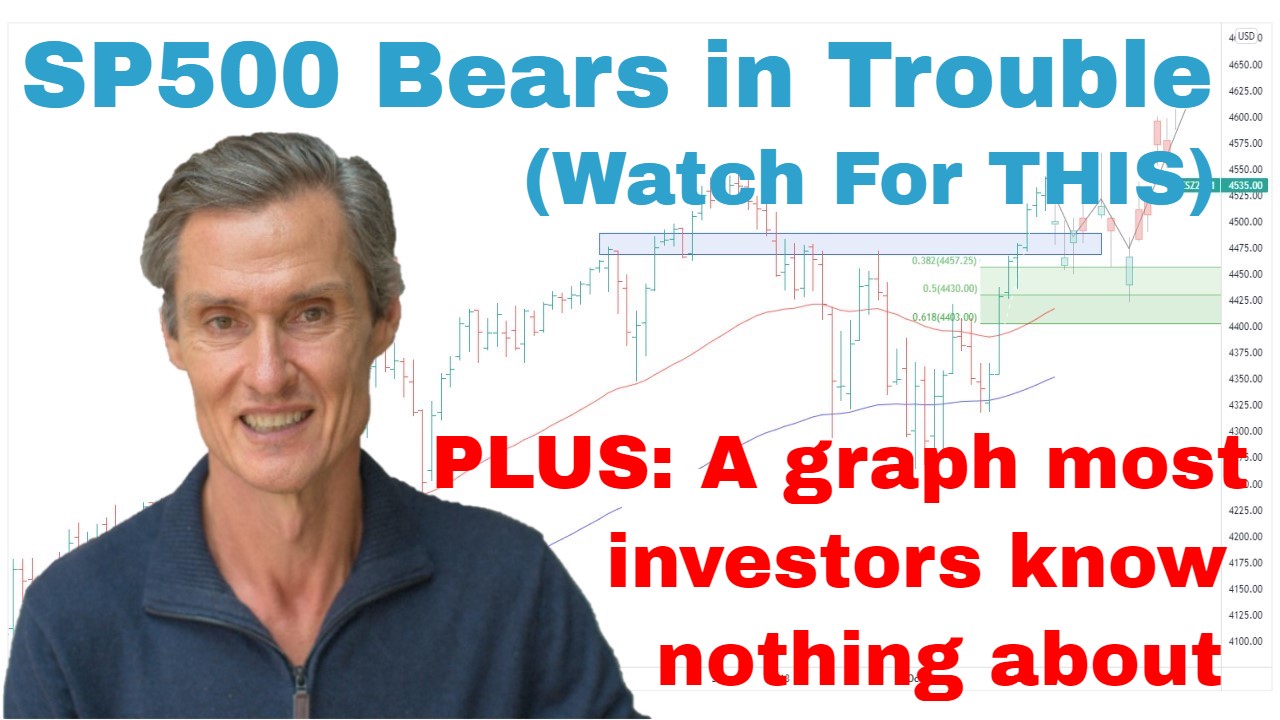
02:44 A close up analysis of SP500’s price action
04:00 Look for THIS to happen next week
05:30 Here’s what I’m doing now
07:35 Were are you wrong? (Most people can’t answer this)
08:32 Nasdaq rally takes many by surprise (can it continue?)
10:46 Big breakout in this key market
12:10 This is the sort of stock set-up I’m looking for
14:00 Here’s an SP500 graph most people don’t know about
Transcript
Please note: Charts available from video
This video is going to focus on the S&P 500. I’m going to cover the ASX 200, copper, gold, and uranium in a separate video, and I’ll leave a link for that in the description section below. I’ve also got a fascinating graph for you that gives a surprising idea of where stocks could be going, and I’ve got an individual stock to show you as well that I’m currently looking at, so make sure you stick around for that. As always, this is general commentary and doesn’t take your personal situation into account. With all of that said, let’s get into our first chart.
All right. So, S&P 500. Well, this has been a significant week. It’s been a significant week for the stock market. Big developments really. As we’ve spoken about, last week we had the breakout above this trend line, dating back to the start of 2022. What’s been significant this week is that we’ve had an acceleration up and away from the trend line. So, it’s a clear-cut break of a long-standing downward trend line.
And the other significant development is the moving averages. So, I’ve got the 50 and the 100-day moving averages on the screen. And they’ve now clearly turned higher and they’re starting to trend upwards. Now that’s the first time that’s happened since… Well, the last time the 50-day moving average was above the 100-day moving average and they were trending higher, it was way back here, back in January 2022. So, it’s been a while since we’ve seen a setup like this on the S&P 500.
The other significant development this week has been a close. Thursday’s close is the highest close in five and a half months. Got to come over here, back over to August for another close at this level. Now, what’s significant about that is this is the first time the S&P 500 has closed at at least a five-month high since going back to the market peak, back in 2022. It hasn’t closed at a five-month high since way back then. So, some really interesting and I think important developments going on in underpinning what is becoming a really interesting and unfolding story in the stock market.
Now, let’s go over to the four-hourly chart, just get a little bit more detail on the latest move. And it’s interesting to look at the structure. So, we had the market, the S&P 500 tested this down trend line in mid-January, pulled back, found support, and then started to rally again. And what we see with this rally sequence off the low from mid-January is that the rallies are impulsive and pullbacks have been relatively short and overlapping. And then you get another impulsive rally, a corrective pullback, and another impulsive rally. Now that price action is really important because what it shows, it shows you that the dip is being bought, shows you that there’s accumulation on the declines. And that’s a critical step in any sustainable advance. You need to see the pullbacks being supported and accumulation buying the dip in an impulsive rally. That’s the underpinnings of a market which is trending upwards.
Coming back to the daily chart. The question is, where to from now? Where is this market heading at least over the near term? And I think a thing to take on board is just in the last three days, so that is Tuesday, Wednesday, and Thursday because, of course, I’m recording this on Friday afternoon in Sydney. I don’t have Friday’s price action from the U.S. Over this three-day period, the market has rallied 5% from low to high. That’s a pretty big move in a short space of time. It’s also pulling away from the moving averages. So, from my read of the chart, from my experience of how these things unfold, this would be a natural place to get some sort of a pause, some consolidation after the initial break higher.
And if that were to happen… Now, of course, I don’t know that will happen. Maybe the market does continue to push higher, but if we do get some sort of a pause, what I want to see, as I was talking about before, I want to see buy the dip type activity start to come in, start to underpin the market. But also, I want to see the strong stocks start to move sideways rather than pulling back abruptly. And we want to see accumulation. If we see that, it’s just another block in the process of building a sustainable advance. And as I’ve been saying for several months now, for me, it’s a case of let’s see where this momentum takes us. I’ve been saying that since… I can’t remember exactly when, but for a while, I’ve been saying as the market advanced from the October low, it’s been let’s see where this momentum takes us. And so far, that’s been playing out. It’s been the strategy that has been delivering the better outcome. And I think the path of least resistance remains to the upside. There’s plenty of macro reasons people can tell me as to why the market should fall but the market is rising, and it’s not about what the market should do, it’s what the market is doing.
And what’s been really interesting since these lows in January is that this move upwards we’ve had over the last four or five weeks has been met with disbelief. It’s been met with skepticism. And that’s typical in the early stages of an advance. It’s just natural for people to think, “The conditions have been bad, the conditions are bad, the market should be falling.” But when I look at the comments after last week’s YouTube clip, the YouTube clip before that, I’m seeing things like, “Hey, this is a great place to go short. Hey, the high for the year is in,” and people giving me these long detailed description of why the market has to fall. And some people get quite angry that I suggest, “Well, maybe there is a possible pathway to see this market go higher.” This is the thing I’d say. It doesn’t matter what we think the market should do. It only matters what the market is doing. And now that trend, that path of least resistance is higher.
So, what I’d say to people is if you’ve got a bearish view, where do you say, “Well, the bearish view is wrong, I need to buy?” It’s like do you sit it out for a year if the market continues to rise? I don’t know whether that’s going to happen or not, but these are the possibilities.
My preference is rather than box myself into one view or another, I’ll go with the momentum. Momentum is currently up. I’ll go with the momentum. I’ll use risk management strategies. I’ll use stop losses, trailing stops to minimize my risk if I’m wrong and the market rolls over. Enough money right for a few months. There can still be some decent gains to be made, then maybe the bears have their way. But if the market continues to rally, I’m in, and I’ve got risk management to help me manage those positions.
Now let’s quickly jump over to the NASDAQ. Interesting price action in the NASDAQ again. It’s supporting this bullish possibility that the markets do continue to rise. We’ve had an acceleration out of this bearish wedging formation. So, the bearish wedge is traced out by these green converging trend lines. And as the price action moves towards the apex of the wedge, it loses momentum before ultimately turning up and breaking into the upside. That’s what we’re currently seeing. Definitely scope for some consolidation, for a pause in this trend. It has been a strong move out. It’s typical for a market then to pull back, have some sort of a consolidation before then rallying again. I’d also note the moving averages haven’t quite crossed yet. And so once the market rallies from below the moving averages to above, quite often, I’ll see the price then pull back towards the moving averages, consolidate as the moving averages cross, start to turn higher, then you get a continued rally. That’s quite typical price action that you often see when you look back through the charts.
Interesting just to put some Fibonacci retracements on if that is the high point on Thursday, maybe it’s not. Maybe the market has got further to go. It would give potential pullback targets back towards 11,800, 12,000 thereabouts for the NASDAQ. These are just possible ideas of where a pullback could come to where we’d want to see buy the dip activity starting to kick in. But I think let’s just see how this plays out over the next few days. Let’s see whether a pullback does start to eventuate. But at the moment, as I say for the S&P 500, path of least resistance does appear to be to the top side.
Now, if you’re getting some value from this, please hit that like button. Please leave a short comment, just “Hey, thanks for the video.” It just tells YouTube that people are watching, people are engaging. What YouTube does, they show it to more people, and that’s really important for me, so please do that. It helps heaps. And also, hit the subscribe button if you haven’t already done so.
Now quickly just moving to the Russell 2000, the small caps. Interesting price action here. Again, we’ve got the breakout from a technical pattern on this index. A technical pattern is a triangle. It’s been forming since back here in June. Quite a nicely structured triangle. Big break to the top side. Moving averages have crossed. What’s interesting with this crossover in the moving averages for the Russell, the last time the moving averages in Russell were positive, the 50-day was above the 100-day and they were rising. We got to go back here to November ’21. So, it’s been a long stretch. Now we’ve got this positive crossover. So, again, I think possibility of a pullback. I’d want to be resisting the fear of missing out mindset where people, they see a run, they think, “Oh, well, I’m missing it. I’ve got to get in.” These markets often pull back.
Hopefully, if you’ve been watching the video, you have been doing some positioning as we’ve been breaking above levels and starting to move higher. And then it’s a case of letting those trades run using risk management. If you’re not in, you want to get in, I think the play here is see if we get the pullback, we get the consolidation, we see what base develops, and then play it from there. And I think it’s about waiting for the right opportunities if you’re looking at the individual stocks.
I’ll give you a quick example of the stock that I’m looking at. Alcoa. Alcoa came up in my scans through the week. Interesting stocks. Had a big pullback from the high. We’ve got this rounding basing formation which has taken place over the last few months. The moving averages have crossed. The 50-day moving average is above the 100-day moving average. These are all positive signs. You can also see a head and shoulders formation with the left shoulder, the head, right shoulder. Not a dissimilar pattern to what we’ve got in the S&P 500. And you can just draw a little bit of a neckline across there. You can see the breakout point. We’re currently having the pullback. For me to get a buy signal on this, I’d like to see the January high broken. So, once the moving averages cross, I’d like to see the market make a new high as an added confirmation. And also drawing in a resistance point across here. So, it makes this a nice entry trigger around 5780.
So, that’s the way I’d like to play these markets. I want to play stocks where we’ve had downside, we’ve got basing formations, and we’ve got breakouts. That’s where I think you get the best risk reward. That’s where you get the asymmetric risk reward. And I think, for me, that’s the safest way to play these markets. And, of course, I use risk management. I’ll have a stop loss below the market. If it breaks high and then fails, I’ll have a get-out. I won’t then continue to hold as it falls away. But if the rally gains steam and starts to run, well, then I’ve got a good position.
One last quick thing. One quick thing which turned up in my Twitter feed through the week I thought was interesting. This is an S&P 500 Index vs. Sectors trading above their 200-day moving average. And now the way this works, when you get 9 or more sectors above their 200-day moving average, you get conditions which have historically led to some good increases in the S&P 500 index. So, you can see all these lines. These are points where the… Down here we’ve got the sectors of their 200-day moving average. This dashed line represents nine. So, when the sectors cross the dashed line is where you see these horizontal markets. And you can just pause this and go through it a little bit slower, but just look at where we are now. We’ve just crossed above that nine threshold. There are now 10 sectors above their 200-day moving average.
So, is history going to repeat? Is this going to be a point where stocks rise? This is why I say have an open mind. Yeah, I know macro doesn’t look good, but I’m looking at the technical signals. I’m looking at the setups, I’m looking at the structure of the market. And there’s a possibility that this market does continue to rise and defy a lot of expectations. Maybe we’ll look back in 6 or 12 months and we go, “That’s why the market was rising,” then it will appear obvious. At the moment, it’s hard to see the macro environment that supports the rising market, but sometimes that comes afterwards. So, keep an open mind. Watch that price action.
Hopefully, that was helpful. Come back and join me next week. I look forward to talking to you then. Until then, bye for now.
Please see video for more details analysis and charts
Looking for the best ASX stocks to buy now?
Motion Trader‘s algorithms scan more than 2,000 ASX stocks daily in search of medium term investment trends. We then tell our members precisely when to buy shares. And most importantly, we tell them when to sell.
Try a no obligation FREE 14-day trial of Motion Trader, and see what an algorithmic trading approach could do for you.
Meet Jason

I'm Jason McIntosh, the creator of Motion Trader. My career began in 1991 on the trading floor at Bankers Trust. Nowadays, I trade my own systems from home in Sydney.
Motion Trader is for investors who value robust analysis, data driven entry and exit signals, commentary, and education. I use engineered algorithms to identify when to buy and sell ASX stocks. No biases or guesswork, just data driven signals.