SP500 About To Surprise Many Investors | Episode 100
Where is the Stock Market Heading?
00:00 Intro
00:34 SP500 price action is fascinating (look out for this)
03:34 Probability favours SP500 does THIS next
05:15 One guy said this is “voodoo nonsense”
08:59 This is what the Nasdaq is telling us (make sure you’re listening!)
10:58 You need to see what the Russell 2000 small caps are doing
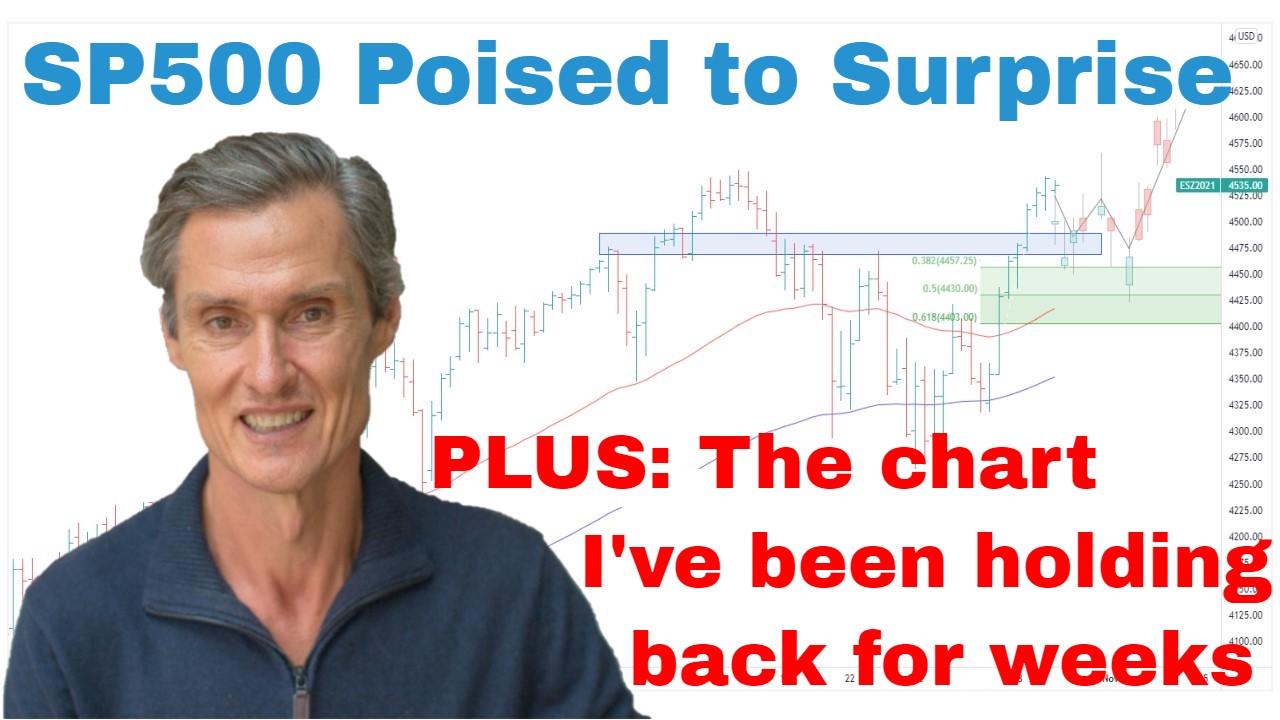
11:22 I’ve been holding back this chart for weeks (this is why)
Transcript
Please note: Charts available from video
This video is going to focus on the S&P 500. I’m going to cover the ASX 200, gold, copper, and uranium in a separate video, and I’ll leave a link for that in the description section below. I’ve also got a fascinating graph for you. I think it gives a big clue to where the S&P 500 might be going next, so make sure you stick around for that. As always, this is general commentary and doesn’t take your personal situation into account. With all of that said, let’s get into our first chart.
So, S&P 500. Well, this is really getting fascinating, such a fascinating chart to look at. So, what we’ve had in the last week is that the S&P 500 has broken out of this triangle trading range that I was speaking about last week, and the market is now back up testing this trend line. And as you probably know, this trend line dates all the way back to the market peak back in January 2022. And what I thought last week, last week I thought we may have had an excursion to the downside, not a big one, just a brief final flush out before potentially then turning upwards. But we didn’t even get there. The market couldn’t even break lower from a point of vulnerability last week.
So, last week, I was saying the market was vulnerable because it was trading below the moving averages. So, I’ve got the 50 and the 100-day moving averages on the screen. And it was also below this resistance region around 39,000. So, if a market is going to sell off, that’s pretty much the time where I would expect it to happen where you’ve got these heavy overhead regions, and a lot of bearish sentiments. So, it did appear if it was going to sell, that was its chance, but it wasn’t able to. The market instead has turned and it’s rallied through this resistance, and is now testing this trend line.
So, let’s just jump over to the four-hourly chart and have a look at it from that perspective, and just get a little bit of a closer view on this triangle. So, you can see the range which formed over about two weeks, got the breakout, got a return move to the top of the triangle which you often get from these patterns, and then we’ve had the continued rally. Now, I think with this trend line, I think this trend line now is more of a general guide. I don’t think we want to use it as a precise point for whether the market is breaking upwards or reacting down from it. It’s such a watched trend line now that I think it loses a little bit of its power in terms that so many people are looking at it. Also, we’ve had this excursion to the upside on this CPI release a couple of months ago. So, it’s not a perfect line anymore, but still a very good general guide to the overall trend.
I think what’s more important now is what the market does now it’s above this 3900 region, which as you probably know, it dates all the way back to May last year. So, I think the key now is, what happens? We’re now above here. Can the market rally extend? And I think that the inability to sell off last week when the market did appear to be vulnerable, I think what that suggests to me is that the probability now favors that we may well see some further upside over the next couple of months. And I also think that the fact the market couldn’t sell off, it suggests to me that the selling is drying up, and that the path of least resistance may now be turning to the upside.
So, let’s just go back to this daily chart. And what I want to talk about here, I just want to talk about this potential inverse head and shoulders pattern which you’ve probably heard me talk about this a few times over the last month or so now. This is potentially a shoulder, potentially a head here, and this is possibly the right shoulder which is currently being formed out. So, these are reversal patterns.
Got an example just from not that… It’s a little while ago now. It was back in September 2021. I remember talking about this at the time. Quite similar to what we have now but on a much smaller scale. You can see the left shoulder, you can see the head, and you can see a smaller right shoulder which is very much like what we have. Now, this isn’t to say that the S&P 500 is about to do that, and just rally straight upwards without stopping, it’s not to say that whatsoever, but that’s the potential which this pattern does hold. That does often lead to a reversal of some sorts, and a change in the underlying direction of the market, which is what I think could happen over at least the next couple of months.
And something else I want to mention is these technical patterns. A lot of these technical patterns have some quite funny names. We talk about head and shoulders, and wedges, and pennants, and flags. And some of the fundamental guys, they’re pretty quick to dismiss technical analysis, I think often because of some of the names which are associated with it. I had one guy on the video in the comments section, it was a few weeks ago now, he said, “This is just voodoo nonsense.” And the thing is I think if you can get past some of the names, I’m sure you have because you’re watching, you’re probably interested in technical analysis, but those who are a little bit wavering can get past some of the names and focus on what the price action is actually suggesting. I think it really can help identify the possibilities of what the market could be doing.
So, just look at this period from the peak through to the October low. And we’ve got this period where we’ve got lower lows and continuing to have lower highs as we’ve gone through this sequence. Now, what we have now, we’ve got a situation where even now still, over the last few weeks and continuing now, we’ve got a lot of people anticipating a new low. They’re anticipating that the market is about to do this, and full break the October low and really have this big capitulation sell-off.
But I think what we’re actually seeing is something different. We’re seeing a situation where the market hasn’t been able to sell off as anticipated. And that’s what happens when you start to see this sort of pattern. So, it might have a strange name like a head and shoulders pattern, but what it’s telling you is that when the market can’t follow through with downward price action and make a new low, it’s telling you the ceiling has potentially dried up. And that’s what sets the stage for higher levels. And how it can play out is that those who would short the market see that the lower levels aren’t happening, the shorts start to cover, then those who are early on the bullish side start to buy, start to add more to their positions. Those who are on the fence then come in and start to buy, and then you’ve got the low-conviction bears, they start to buy, and the whole process continues to defeat upon itself.
So, yes, the macro environment always matters, but with respect to the macro guys, they can’t see the future either. So, that’s why I always suggest if the market is rising, I think we only know why it’s rising. Often we only know in hindsight why it’s been rising. So, that’s why I say keep an open mind, go with momentum, and manage your risk. That’s the key to this. And that’s what I’ve been telling you for the past few months. I’m long stocks. I’m long the S&P 500. I’ve still got plenty of cash on the sidelines, although I am slowly putting that back into the market. So, keep an open mind as to where this market could go at least over the next month or two, and be open to that upside possibility I think which is still quite contrary to what low people are expecting and anticipating.
Now, if you’re getting value from this, please hit that like button, please leave a short comment, just, “Hey, thanks for the video.” It just tells YouTube people are watching, people are engaging. YouTube shows more people, and that’s really important for me. And hit that subscribe button just below the video. And do that. It helps me a heap. So, please do that. Much appreciated.
And now NASDAQ. Let’s jump over to the NASDAQ. Interesting price action here as well. I told you last week about this potential bullish wedging formation which is appearing on the chart. Here with the bullish wedge is that we can see these converging trend lines. And the theory here is each time the market hits a new low, it’s doing so on less and less momentum. This occasion hasn’t even hit a new low, at least not as yet. So, it’s telling you that the selling pressure is abating and the market is struggling to go lower. And so that then potentially sets up the situation for reversal. So, now I’m watching this resistance point here at around 11,600. The market is just sitting beneath at the moment. It’s sitting below the moving averages.
So, from that perspective, there is still vulnerability in the market. We don’t want to steam in and say the market has made a low, it’s going to charge higher. But if we see this price action continue to develop over the next week or two, and we can get a break out of this pattern, break above this resistance point, that really does open up the potential for some reasonable upside. So, from where the market currently is now, just to the top of this pattern which would be the standard measured move you’d look out of a wedge, that’s a 20% move. So, I think it can be an expensive exercise to rigidly hold one view that the market is going to do one thing. In this case, the market is going to fall and it can’t go up. That 20% can be a painful 20% to watch. So, keep an open mind, and I think be open to the possibility that the market may not fall at this point, at least, despite what still appears a pretty ordinary macro backdrop.
Just briefly, the Russell 2000, the small caps. Look at this. It’s breaking up out of a trading range. It got above this resistance point a week or two ago, breaking up above the trading range now. It has this scene, its maximum selling at least for now. It’s looking like it’s going to test higher. The path of least resistance seems to be shifting to the upside.
Now I just want to show you something else which is really interesting. I’ve been watching this for a while but I haven’t brought it to your attention because I haven’t really been able to put all the pieces together. It hasn’t quite been ready to fit. Looks like it is at the moment. So, what I’ve got here, the top is the S&P 500, beneath it is a high-yield corporate bond ETF. It’s one done by iShares, ticker code is HYG. So, as this falls, it means that high-yield bond yields are rising. So, they’re selling off high-yield bonds when this falls. Now, look at these blue-shaded areas. You can see that when the bond yields reach their peak, when the sell-off and corporate bond yields bottoms, it tends to coincide with a low in the S&P 500. You can see that in 2009, 2016, 2020.
Here we are here in early ’23. Is this the low for corporate bond yields? Are they starting to turn higher? And if so, does that take the S&P 500 higher with them? They’re gauge. It’s not corporate bond yields are magic or anything like that, but they’re a gauge of the underlying economy. Corporate bond yields tend to fall when the underlying business conditions are favorable.
So, I just want to zoom in on a daily chart on this section here of the corporate bond yield. Just going over and having a look at that. And so this is this point, this low point in the shaded area on the previous chart. And what I find interesting about this, after this big fall that we’ve had during 2022, again, we’ve got this head and shoulders type formation, so…inverse head and shoulders I should say, so just getting away from the funny name again. It’s like we’ve got a market which has attempted to sell off to a new low during December, hasn’t been able to find that follow-through selling to make the new low and is now reversing in the other direction. It’s above the moving averages, the 50 to 100-day moving averages. The moving average are becoming close to crossing. So, is this a bottoming formation in bonds which would then follow through to do we get upside momentum in stocks? It’s a really interesting situation I think we’re seeing in the S&P 500. And I think, yeah, let’s watch this closely over the next week, see where this goes. It’s really becoming interesting in this market. It’s fascinating to watch. Hope you’re finding it enjoyable as well.
And thank you for joining. Thanks for starting 2023 with me, and look forward to coming back and talking to you next week. Until then, bye for now.
Please see video for more details analysis and charts
Looking for the best ASX stocks to buy now?
Motion Trader‘s algorithms scan more than 2,000 ASX stocks daily in search of medium term investment trends. We then tell our members precisely when to buy shares. And most importantly, we tell them when to sell.
Try a no obligation FREE 14-day trial of Motion Trader, and see what an algorithmic trading approach could do for you.
Meet Jason

I'm Jason McIntosh, the creator of Motion Trader. My career began in 1991 on the trading floor at Bankers Trust. Nowadays, I trade my own systems from home in Sydney.
Motion Trader is for investors who value robust analysis, data driven entry and exit signals, commentary, and education. I use engineered algorithms to identify when to buy and sell ASX stocks. No biases or guesswork, just data driven signals.