S&P 500’s Historic Reversal | Episode 77
Where is the Stock Market Heading?
00:00 Intro
00:33 This is a classic bear trap
02:46 How Thursday’s SP500 reversal compares with other key reversal days
07:29 Could this be the start of a new SP500 bull market
08:44 A textbook Elliott Wave pattern (and what it means)
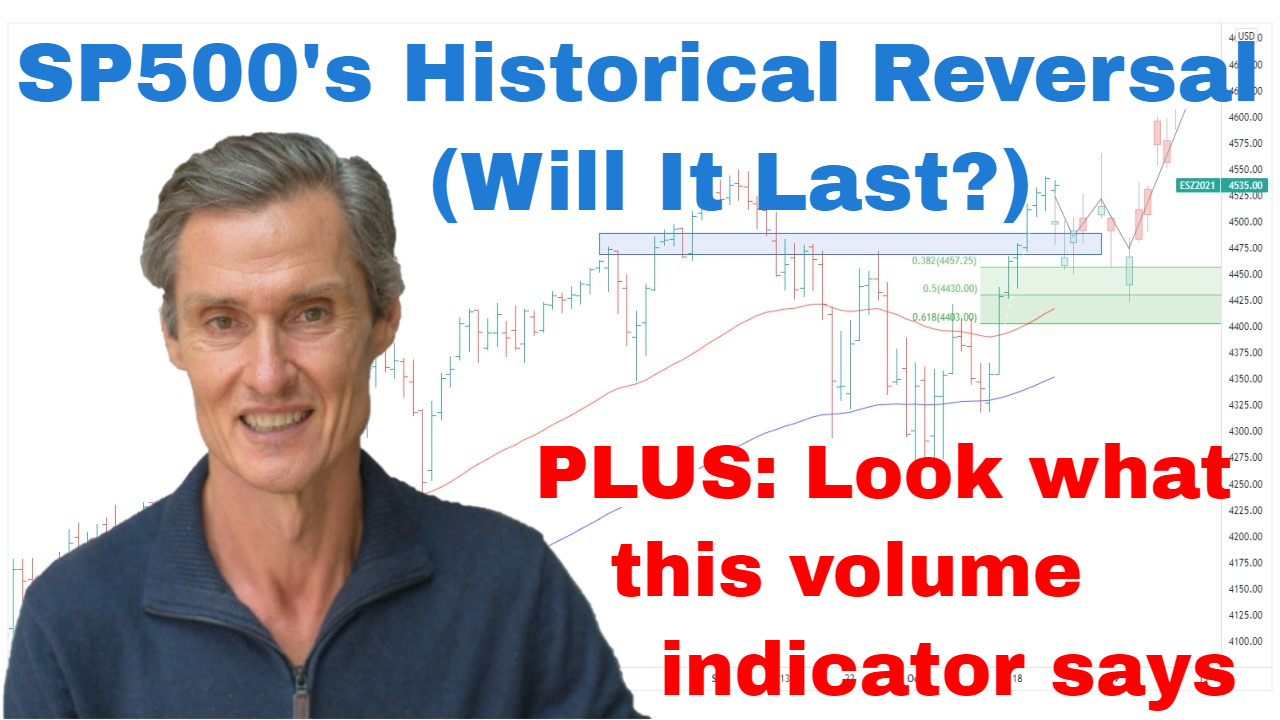
09:12 Watch this cluster of key levels in SP500
09:59 This volume study indicates an unpleasant possibility
Transcript
Please note: Charts available from video
This has been one of those classic weeks in the S&P 500 where you could have been bullish or you could have been bearish and you could have lost money on both sides. What we saw on Thursday was really one of those classic bear traps. We had excessive negativity leading into that CPI release. CPI data came out, it confirmed inflation is running hot and the market sold off. But to many people’s surprise, that didn’t trigger follow-through selling, and the crash scenario that so many people thought was coming didn’t play out, and instead what we got was a big short-covering rally.
And what I think is fascinating is to jump over to the four-hourly charts and just have a look at how this has all played out. So, this blue line marks the June low. That’s been a pivot point we’ve been watching over the last several weeks. Just coming in a little bit closer, we’ve had three breaches of that June low, and on each occasion, the market hasn’t been able to sell off. Quite often, what you find when you get to a low point, it’s a natural place where you find a lot of sell orders. It’s where people who own stocks will liquidate them, and it’s where people who want to trade short will put on new short positions. And on each of these occasions, we’ve hit the trigger points but there hasn’t been enough selling to really propel the market lower. And it’s a sign of a market which is, at least for now, at least temporarily become exhausted on the downside.
And it’s one of those…it’s called a bear trap because people get bearish at precisely the wrong time and then they’re trapped and they got to cover their shorts. And that’s what’s filled this rally over from the low point on Thursday. And I think we’re now in a situation where there are going to be other shorts in there which potentially need to cover and people who want to be early in on potentially the next advance, and that has a potential to fuel a continued rally up towards this resistance band at 3900.
And another thing which is interesting about this advance is that…What’s interesting about this reversal is that it’s actually the fourth-largest reversal from a 52-week low in the S&P 500’s history. So, I’ll show you some interesting data which came up in my Twitter feed through the week. It’s from the guys over a SentimenTrader who do some really good stuff. So, this is showing the S&P 500’s largest reversals from a 52-week low. So, here’s this one from Thursday. We were down 2.39% early on, closed up 2.6%, so a big reversal day. If you’re interested you got the NASDAQ data on the right-hand side.
So, what I thought would be interesting is what did it look like on these occasions up here on these other times in history where we got these large reversal days? And then can we use these to try and figure out whether the low we saw on Thursday, is it a final low, or is it just an interim low? So, let’s start with 1962. Let’s jump back there, see what was happening. So, this is a day in 1962. Biggest reversal day in the S&P 500’s history. It had come on the back of a lengthy decline through the year, probably about a four, five-month decline, and it was quite a strong down-trending market with an accelerated low, a real capitulation into this low-point. Strong rebound didn’t last very long. It was then another grinding sell-off. The final low wasn’t that much below the spike low and the reversal day. And then that led to a significant ongoing new bull market which lasted for quite some time, for multiple years. So, that is one of those scenarios.
Go back to our lineup here, 1987. Well, that was a crash low. That’s not at all like what we’re seeing at the moment. 2008, January, that wasn’t a bull market. That was before the GFC peak. So, again, not particularly relevant to what we’re seeing now. 2002, that was during the GFC decline, near the end of the GFC decline. Quite similar to the ’62 example. So, again, not so much like now. What was interesting is this one down here from 2011 because there are quite a number of similarities with what we’re seeing currently.
So, let me show you that example. So, this is our example from 2011. We had a market that peaked early in the year, started to roll over, made a notable low in August, tried to rally from that, had several attempts at breaking to a new low just like we’ve recently seen, and then it did break through. It broke down to a new low. This is a point where you’d expect all the stop losses, all the follow-through selling, but the follow-through selling didn’t happen. Market had the reversal date, went on to a significant rally that lasted for quite a while. And what was also interesting with this was the sell-off was coming off an extended rally from the GFC low. And around this point in time where the breakdown occurred, it was a European debt crisis. The U.S. debt ceiling was an issue. People were fearful that…A lot of bearish sentiment. People were fearful that this breakdown was going to lead back to the GFC low. So, there was a lot of fear around this time, but that’s not how it played out. And the big question now is, would what we’re seeing now be similar to this point and lead to a significant rally over the coming months and into a new bull market?
And before I get to the answer or at least what I think is the answer to that, if you’re getting some value from this, please hit that like button. Please leave a short comment, just, “Hey, I like the video. Thanks.” It tells YouTube that people are watching, basically. And that’s why I make these videos to try and help people understand what’s happening in the market. So, if it’s helping, please let YouTube know so YouTube shows more people. And that’s why I do this. And also, maybe subscribe if you haven’t already done so, and come visit me over at motiontrader.com.au. Okay, with that said, back to the charts.
So, here we are today. Let’s go back to our daily chart. And could this be a rally like we saw in 2011? And at this stage, unfortunately, I think I’ve got to say my feeling is no, and that’s because it’s quite a different environment. What we’re seeing now is quite different to the whole macro landscape in 2011. Back in 2011, interest rates were at zero. Quantitative easing was all the rage through all the central banks. Now we got the opposite situation. We’ve got interest rates rising, we’ve got central banks tightening liquidity. So, the backdrop is quite different. I don’t think we should be looking at this as a final low, and I don’t think now is a time to be heavily loading up on stocks.
That said, I think there’s definitely the potential for some more upside over the coming weeks. Now I think there’s more shorts that need to cover and more people who want to try again early to fuel a continued rally. And that really could last a few weeks, but I just don’t think at this stage that we’re looking at it as a new bull market. It’s also interesting to look at this move from August in that it looks like a complete move. If you’re interested in a little bit of Elliott Wave, you’ve got a five-wave decline. So, from the peak, we’ve got wave one, two, three, four, and five. Really clearly defined Elliott pattern. After a fifth wave, the theory is that then you get a correction to the upside, which again suggests maybe we could get up to around 3900, maybe beyond.
Another thing which is interesting to look at, we can put some Fibonacci retracements on. And when we do that, we find there’s a cluster of resistance bands, again, in around this 3900 pocket. Also, got the moving averages coming through around that same point. So, that would be a very natural place for the market to try and rally back towards if, in fact, we see follow-through buying, which I think the odds favor that we will maybe over the next several weeks. If the S&P 500, if it can get above these levels, if it can get above the moving averages, well, then we can start looking at more bullish scenarios. But for now, I think the base case has to be this is probably a bear market rally which is getting underway.
And I’ll just quickly show you one more reason why I think this is a bear market rally. It’s a volume study which I’ve been having a look at. And what I’m using for this is I’m using the SPDR S&P 500 ETF, which happens to be the largest ETF in the world, because I get a good volume profile when I use this particular product. And what’s interesting here is when you go back and you look at bear markets or significant declines, you find that, well, as far as I can see, there’s always a big ramp-up and volume leading into a climactic sell-off. And you find this all the way along. So, this is during the GFC. Big run-up and volume. Move along into 2010, a notable correction with a lot of fear. Volume ramps up. Same here in 2011. You can go all the way along, look for the spike lows in the index or in the ETF, and you see that volume accompanies those declines all the way through here. There’s the COVID crash, big increase in volume.
Now look at what we have in current times. Market has been coming off, a huge amount of negativity, but where’s the volume spike? And this is a thing which has been missing. We’ve been missing that capitulation low, that big increase in volume, which so often signals a low is in place. So, this is why I think maybe this is an interim low, maybe this is going to lead to some recovery maybe later in the year or in the first quarter of next year. Maybe does go down. Maybe it does break the low, then maybe we do get more capitulation. I don’t know. I really don’t know. It’s looking at the price action, it’s trying to work it out as we move along.
At the moment, it looks like we could get some sort of a rebound, but be aware that we don’t have all the ticks in all the boxes to suggest this is a new bull market, not at this stage. So, I think the play here is stay defensive. I think it makes sense to have some exposure to the market here. Anything is possible. It does look like we’ve got a short-term trend change. If it does develop into something larger, if you’ve got some position around here, you’ve got a toe in the water, you’ve got a position to potentially add to. But if this rally does fail and start the head lower, we have an obvious exit point below Thursday’s low. So, I think there’s enough evidence to have a look at this market, but there’s not enough to get excited about it. So, some environments about making money, but this one is very much about not losing money.
Please see video for more details analysis and charts
Looking for the best ASX stocks to buy now?
Motion Trader‘s algorithms scan more than 2,000 ASX stocks daily in search of medium term investment trends. We then tell our members precisely when to buy shares. And most importantly, we tell them when to sell.
Try a no obligation FREE 14-day trial of Motion Trader, and see what an algorithmic trading approach could do for you.
Meet Jason

I'm Jason McIntosh, the creator of Motion Trader. My career began in 1991 on the trading floor at Bankers Trust. Nowadays, I trade my own systems from home in Sydney.
Motion Trader is for investors who value robust analysis, data driven entry and exit signals, commentary, and education. I use engineered algorithms to identify when to buy and sell ASX stocks. No biases or guesswork, just data driven signals.