Only Buy ASX Stocks Like This | Episode 76
Where is the Stock Market Going?
00:00 Intro
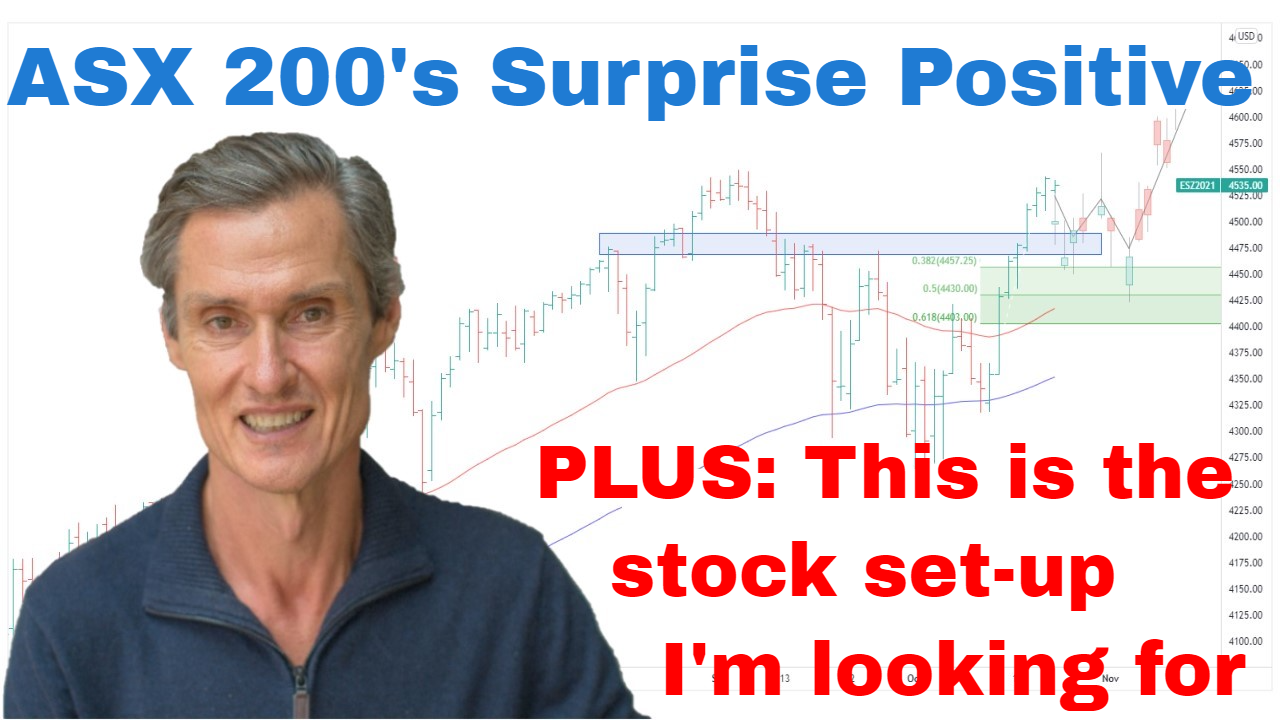
00:29 ASX 200 strengthen its position (plus an extra positive)
02:33 But don’t overlook this key hurdle
03:18 An emerging opportunity in the Small Ordinaries
05:20 I want to see more price action like this (in individual stocks)
08:21 Uranium edging higher (but beware of this)
Transcript
Please note: Charts available from video
It’s been another positive week for the ASX 200. I think it’s further strengthened its position after forming this double bottom down here at around 3400 a couple of weeks ago. And we’ve now got two key support levels to keep an eye on for the ASX 200. We’ve got Thursday’s low, which comes in at 6510, and then the second is, of course, a double bottom at around 6400.
Another interesting feature for the ASX 200 is that we’re seeing price divergence with the S&P 500. So, let me show you what I mean. So, what we have here on the top is ASX 200, and below it is the S&P 500. So, we have a situation where the S&P 500 has made a new low while the ASX 200 has stayed well above its previous low. And another name for this type of price divergence is non-confirmation. And it’s a sign that the ASX 200 is becoming…it’s becoming resistance to the selling pressure that’s been playing out over the last several months.
And if we go back to our ASX 200 chart, what we can see now is that prices are now testing the first of the moving averages. So, this is a 50-day moving average, and above that, we have the 100-day moving average. And what we often find is that during a time of rising prices, the moving averages often offer support, whereas when the market is in decline, the moving average will often be a point of resistance. Nudged through it here, and then came back down. That then became resistance point again, and now here we are. So, will the market pause here or be able to push through? That’s what we need to wait and see.
I think we also need to remember that until the ASX 200 can get above these moving averages, and until those moving averages actually start to turn higher and cross, I think we need to remember that this may not be all over by any stretch because bear markets, they’re notoriously difficult, and this one could well and truly still have some surprises. Having said that, the ASX 200 isn’t officially in a bear market. It’s been down by as much as 16%. Market needs to be down 20% for an official bear market. But many parts of the ASX market, generally, are definitely in a bear market. They’re down significantly.
Take the small ordinaries, for instance. We’ll jump over and have a look at the small ordinaries. It’s been down as much as 29%, so very much counts as being a bear market. And there’s been a lot more capitulation-style selling in the smaller end of the market as well. And what we have now, we’ve set up now where the…We’re in a situation where the October low has held. In the most recent sell-off, market hasn’t been able to come back to this October low. So, that’s a positive situation. And we’re also quite stretched now below these moving averages, which is often a point which is like a rubber band being stretched, it can get so far below like it did here before it does pull back towards it. So, there are some positive signs that maybe this market and the ASX, generally, is going to continue to try and rebound over the next several weeks. But I’ve got to say I think it’s too early to be calling a final low.
It’s certainly an interesting situation because you look at the small ords, for instance, and when you get a little bit more data on this chart, where we are now, it’s back at levels seen in 2017. So, this has been a considerable correction, and I think this is a market which is worth watching. It’s one of those areas of the market which potentially does have some good recoveries potential. And I’ll show you the price action I’m looking for in individual stocks as well.
First of all, though, if you’re getting some value from this, please hit that like button. Please leave a short comment, just “Hey, thanks for the video.” It just tells YouTube that people are watching, people are engaging. When people do that, YouTube shows more people, and that makes such a difference for me. Please do that. It helps me so much. And also, hit the subscribe button, and visit me over at motiontrader.com.au and see the other stuff that I’m doing that might be able to help you with what you are doing.
And now let me show you this price action I’m looking for. This is the stock that turned up in my Motion Trader’s algorithmic scans a few weeks ago. It’s an interesting stock. It’s IAG, Insurance Group Australia. And so what we’d had with this, we’d had a big sell-off in this stock, a big bear market. And as is so often the case during a big bear market, the bear market, it caused a chaotic decline, lots of up-and-down movement, volatility in between, but then it went into this period where there’s just a long grinding sideways movement. And this is so often how markets bottom out. They often bottom out with complete disinterest where people just give up on it. Big fall makes people sell and get out of the stock, but then nothing happens for a protracted period and people get bored and they look for action elsewhere. And it’s often only after a stock turns around and it’s up 50% that people start to pay attention again.
So, let’s have a close look with this IAG at the actual price action recently. And what turns up in the chart is this is like it takes the shape of a large rounding bottom formation. That’s a classic basing-type pattern. And what we’ve recently had is the price has recently broken above some resistance points. So, we can say this is a breakout, and this is where Motion Trader has picked it up. Has picked it up when the moving averages have turned positive to the 50 and 100-day arising, and the prices break into a new high. So, for me, this is when things start getting interesting. And this is the price action I want to see in a lot more stocks across the ASX, across the S&P 500 for that matter. That would give me more confidence that we have lasting lows in place. And I don’t see enough of this at the moment to give confidence in those lasting lows.
And it’s interesting to also just throw a volume study on this chart as well because what you can see is this breakout has been accompanied by rising volume, which is a positive sign. You want to see rising volume on breakouts because that’s a sign of active buying, buyers really pushing to get into the stock. And so that’s the thing I’m looking for. I don’t want be looking for stocks which are just having a good week after situations like this. You got a falling market, you get a good few days, and then the market turns lower. I’m not interested in that upward price action. It’s more a case of looking for that price action like we have here where it’s breaking upwards from a basing pattern, and not just a couple of good days within the sell sequence.
So, let’s jump to uranium. Want to have a quick look at uranium today because it’s had an interesting week. So, uranium just hit a six-month high on Thursday. And it’s actually one of the best-performing commodities which are out there at the moment. You look at the other ones, you go through the metals, through the grains, there’s not a lot which is hitting six-month highs. Uranium is one of them. And we’ve also got the positive moving averages. So, price came back to moving averages, found support there, and is now rebounding.
So, I just want to put this into some perspective. This is a weekly chart, by the way, we’re looking at. Let me just get some more data on this. And we can see big decline, long period of disinterest. Then we’ve got this period from 2020. We’ve got this 2-year stretch where uranium ran 220%, so a big move over 2 years. And following that 2-year run, we then had a 4-month correction which brought the price back 40%. So, the thing that stops me from getting more excited about uranium is that this is a relatively short correction. Pricewise, 40% is a pretty decent correction. Timewise, four months is short. Two years up, four months down. It just makes me wonder whether maybe there’s going to be a larger consolidation that plays out in uranium. Maybe it’s a case of…Actually, I’ll jump back to that weekly chart. Maybe it’s a case that uranium needs to…This isn’t a prediction by any means, but it wouldn’t surprise me to see uranium end up doing something like that over the next several months. It could be that we’re only halfway through this correction. Maybe there’s more of it to play out. I’m just not sure that four months is a big enough consolidation for the extent of the rally that we had and the 2020 low.
But nonetheless, path of least resistance at the moment is up, the moving average is a positive, price has broken to a new high. So, I think it’s fair to give uranium the benefit of the doubt here, but I think it’s also very important, if you’re in uranium stocks, manage your risk. Just manage your risk. I don’t think this is a point where we want to say, “Let’s completely lay it up in uranium.” This is looking great on all time frames, on all measures because, yeah, there’s often question marks, but there’s definitely some question marks in this. So, have uranium exposure if that’s what you want. And I’ve got uranium exposure, but be aware there’s still risk that this may take longer to play out.
Please see video for more details analysis and charts
Looking for the best ASX stocks to buy now?
Motion Trader‘s algorithms scan more than 2,000 ASX stocks daily in search of medium term investment trends. We then tell our members precisely when to buy shares. And most importantly, we tell them when to sell.
Try a no obligation FREE 14-day trial of Motion Trader, and see what an algorithmic trading approach could do for you.
Meet Jason

I'm Jason McIntosh, the creator of Motion Trader. My career began in 1991 on the trading floor at Bankers Trust. Nowadays, I trade my own systems from home in Sydney.
Motion Trader is for investors who value robust analysis, data driven entry and exit signals, commentary, and education. I use engineered algorithms to identify when to buy and sell ASX stocks. No biases or guesswork, just data driven signals.