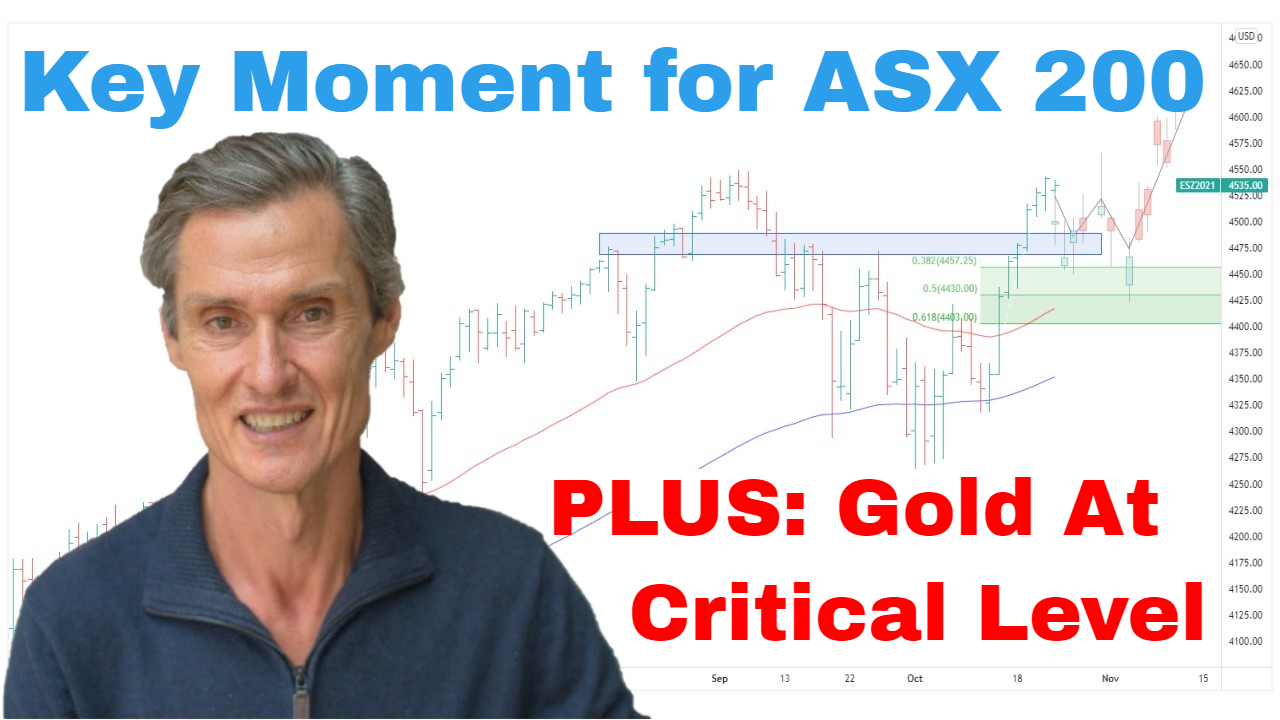
Key Moment for ASX 200 | Episode 64
By Jason McIntosh | Published 2 September 2022
Trade the Trend is a weekly video focusing on where the stock market is going. It’s for investors and traders looking for technical analysis of the ASX shares, the ASX200, the SP500, as well as stock markets and commodities markets in general. Jason uses technical analysis of stocks and trend following techniques to help you piece together the world’s biggest puzzle.
Where is the Stock Market Going?
00:00 Intro
00:28 ASX200 stalls at resistance (why it’s no surprise)
01:29 These levels are key to the ASX200’s next move
04:09 What I’m doing now (and who wins in these situations)
06:07 Is gold about to break this major support?
Transcript (abridged)
Please note: Charts available from video
Last week, I spoke about the possibility of ASX 200 continuing to consolidate. And that’s pretty much what we’ve seen. We’ve continued to see the market pull back after testing a big overhead resistance region between 7,100 and 7,200. And that’s really been capping the price now for several weeks. And it’s quite common for that to happen because these big resistance bands, they often cause a temporary pause in the momentum of a market or a stock. And sometimes that will turn the course of the market, but other times, it’s just temporary. The market consolidates beneath it and then breaks upwards. Time will tell what happens with the ASX 200, whether or not it can break upwards.
Like for the S&P 500 (which I was talking about in the previous video), the key point to watch now are the Fibonacci retracement levels. If we just put them on here for that latest upward leg we have, you can see the ASX 200 is right down in the middle of this Fib region now. So, this would be a natural place for this pullback to stop if it is going to stop, if it is, in fact, a pullback, and then another attempt at rallying. This is where you’d look for it to pull up. And would also be looking for how the market rallies off here if it does, in fact, rebound.
What we want to see, we want to see a solid rebound if we’re going to keep potentially a bullish scenario on the table. Look for a strong rebound, maybe some further consolidation. And for that to provide a base to punch through that resistance area. Time will tell whether that’s the way this market goes. No one can say if that’s going to happen, but that’s one of the scenarios which is on the table, and I think does remain a reasonable possibility.
We’ve also had the pullback below these moving averages. And that’s something that I spoke about a couple of weeks ago in that we often get markets, they rally, they pass the moving averages, then gravity pulls them back down, they retest. And if it’s going to go towards a bullish scenario, it’s then a case of consolidating and getting back above those moving averages. Similar to what we saw through…Here’s an example where the market rallies above the moving averages, falls back below them, and then we start to get a sequence that stays above those moving averages for some period of time. That’s the possibility we’re looking at here, but we need more price action now to see which way this goes. Is it actually going to roll over and become more bearish? Or do we have some recovery underway. Whether it’s lasting, we don’t know, but it is possible we’re going to see a base form, which could support higher levels in the months ahead.
And as you know, I’ve been talking about incrementally getting some exposure to the market over the last six weeks. But right here and now, I don’t want to be adding any more to that exposure. I’d rather wait and see. I really want to wait and see what happens from this pullback from where we are. Either we’re going to get signs that the ASX 200 is getting to retest this resistance, or we will see the market continue to trade lower. So, it’s been a time for caution throughout this whole rally, but right here and now, now it’s a case of wait-and-see.
I think it’s all about really keeping a tight reign on risk because I think the winner during these times is not the person who keeps coming in all the way through and keeps trying to buy the low. I think it’s the person who’s best at protecting their capital, and the person who then is ready to take the new opportunities when they emerge. And that will come through being closely watching the price action, seeing whether we can get this sequence of higher highs, higher lows, and general upward momentum coming into the market.
Now I’ll finish up with having a quick look at gold. What’s interesting with gold is just in the last couple of weeks, we’re really getting close to retesting this big support band. So, you can see this stretches all the way back to February 2020. So, it’s a long-standing support. Gold tested this on multiple occasions, so it’s become significant due to that number of tests that it’s had. And so far, it’s held all those tests. And here we are now right back down near the support.
I haven’t covered gold for a while now. I haven’t covered it since we were back here in May when gold was breaking down and said, okay, well, the bullish breakout we had here, it hasn’t carried on, breaking down, time to step away. Interesting again to revisit it because we are close to this support which comes in at around 1680.
My feeling is that it will hold at this time at this test of it. For a breakdown, I think it would need to build up a bit more momentum than it’s approaching with at the moment. It’s inching its way towards the support. I don’t think it’s ready to go through if it is to go through at all, but I think this is something to watch closely because a breakdown here would be…I think it’d be a significant negative for gold, and it would really put the…I have a longer-term bullish feel on golds. Looking at this on a weekly chart, I think it looks good. I think it looks constructive, but from a near-term perspective, if we were to break this support, it would put any bullish outlook I think well and truly on hold. It’d put it on the back burner. It’d be a negative event. So, watch this closely.
And the gold stocks just continue to look awful. Just quickly looking at one of them. Let’s go down. Let’s have a look at Evolution. The Evolution is down. It’s down close to 70% over the last couple of years. And this is typical of gold stocks generally. There’s nothing bullish about this chart structure. So, that’s a concern for gold stocks generally. I think there’s going to be some terrific opportunities in this gold sector, but there’s been so much technical damage done that I think it’s going to take time to repair. So, keep an eye on gold, but if you like gold, I think time to buy gold stocks. We don’t have a clear view of that by any stretch at the moment. With those downward trends, you’re so established.
Please see video for more details analysis and charts
Looking for the best ASX stocks to buy now?
Motion Trader‘s algorithms scan more than 2,000 ASX stocks daily in search of medium term investment trends. We then tell our members precisely when to buy shares. And most importantly, we tell them when to sell.
Try a no obligation FREE 14-day trial of Motion Trader, and see what an algorithmic trading approach could do for you.
Meet Jason

I'm Jason McIntosh, the creator of Motion Trader. My career began in 1991 on the trading floor at Bankers Trust. Nowadays, I trade my own systems from home in Sydney.
Motion Trader is for investors who value robust analysis, data driven entry and exit signals, commentary, and education. I use engineered algorithms to identify when to buy and sell ASX stocks. No biases or guesswork, just data driven signals.