Is the Rally in ASX Stocks Over? |Episode 60
By Jason McIntosh | Published 12 August 2022
Trade the Trend is a weekly video focusing on where the stock market is going. It’s for investors and traders looking for technical analysis of the ASX shares, the ASX200, the SP500, as well as stock markets and commodities markets in general. Jason uses technical analysis of stocks and trend following techniques to help you piece together the world’s biggest puzzle.
Where is the Stock Market Going?
00:00 Intro
00:32 The rally in ASX stocks that few saw coming
01:22 But watch these signs of waning momentum
02:36 The ASX 200 needs to clear this big hurdle
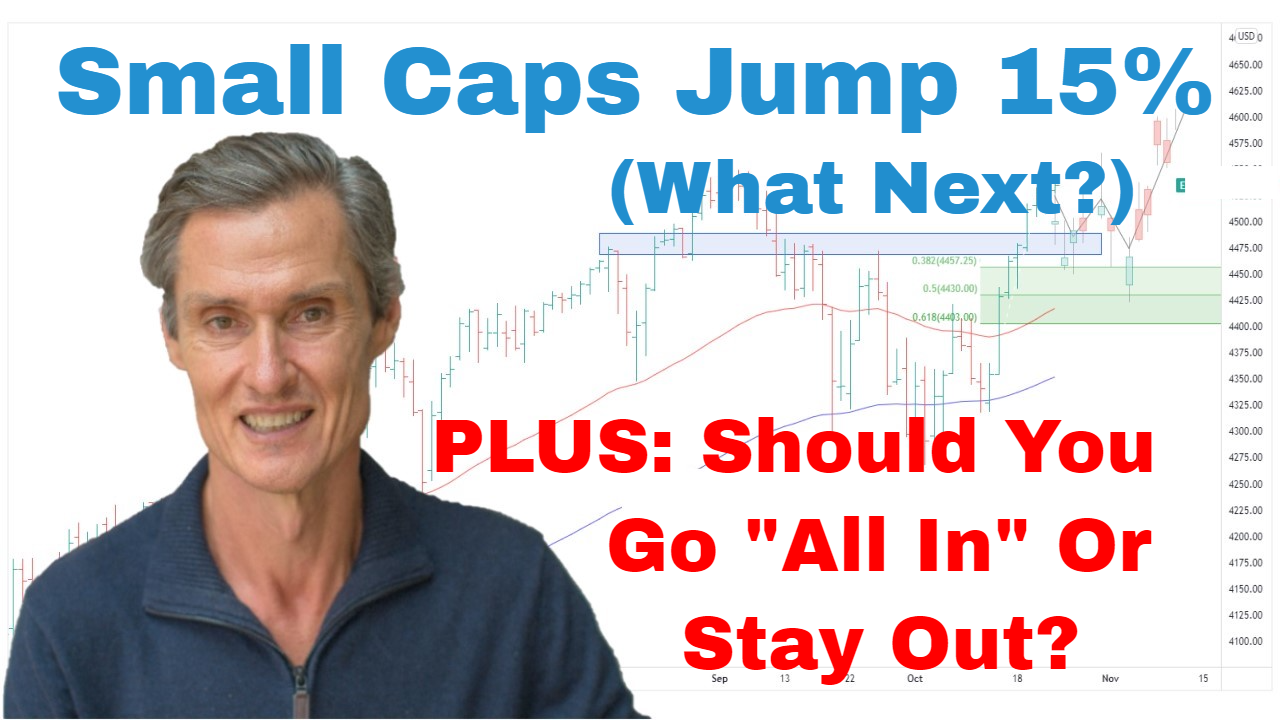
06:58 ASX Small Ordinaries continues to outperform (what next?)
09:00 Look what this proprietary indicator says (we’ve seen this set-up before)
Transcript (abridged)
Please note: Charts available from video
This video will focus on the ASX 200. And to the surprise of many, the market has continued to push higher. And what we saw this week is that ASX 200 actually hit a two-month high on Thursday, the highest level since early June. So, in four weeks, that is an 8.5% rally. That would generally be considered a pretty reasonable year. And that’s four weeks’ work. So, a lot’s been going on. But it does seem that the market is losing some momentum.
Let me jump over to an hourly chart, and have a closer look at this. Now what’s interesting is that over the previous week, the ASX 200 had been consolidating above 7,000. And then during last week, the ASX 200 has attempted to break higher. It’s attempted to push above 7,000 but it’s making heavy work of it. Just looking at the price action, a lot of this is overlapped. It’s not what you’d call impulsive price action. So, impulsive, I mean a clear sequence of higher highs, higher lows. This isn’t the case with the latest price action. It’s overlapped and messy price action, which is often a sign of a market that’s starting to struggle to maintain its momentum. And I think these are signs that the ASX 200 may be getting close to some sort of a pullback.
So, let’s jump back to this daily chart. And what I want to do here, I want to put on some resistance. There’s a key resistance area between 2,100 and 2,200. This picks up some highs, some lows through here, a congestion band, picks up this area, doesn’t match up perfectly. But this is a thing with technical analysis. It’s not about being completely precise with all your levels. Often you’re looking for regions of activity where you can see that the market has found support or has found resistance. And I think this is one of those areas. Now we can see the market is now just beneath that overhead resistance band. So, I think it’s also quite possible now that the market does start to maybe develop some sort of a pullback from around this area. I think that’s probably the thing to look out for, does this area start to put some sort of a weight on top of the market? And if we do see a pullback, I think the key’s going to be, what does that pullback look like?
Now from everything I’m seeing in the media, everything I’m reading online, the consensus view seems to be that this whole sequence through here is a bear market rally. And that could certainly be the case. We just don’t have the information at the moment. We don’t have enough evidence to discount that possibility. So, if the ASX 200 does pull back from here, I’ll be watching the Fibonacci retracement of this latest move. So, I’m going to put some Fibonaccis on. I’m going to use…This is my low point. I’m not using this point here. I’m using this point because I think this is potentially a complete move through here.
And this is a thing with Fibonacci retracements. You’re looking for complete moves not just…for instance, you wouldn’t…I don’t call that a complete move, that’s of two moves put together. That’s a move, and that’s a move. So, there is a bit of art to working out where you draw your Fibonacci regions. So, I’m using that low, and this may not even be a high. Maybe the market makes a new high next week. But just for argument’s sake, if that were a complete move and we were looking for a Fibonacci retracement, we end up with this band through here. So, if this were the case, I’d be looking to the market potentially pull back maybe to around this 6,800, maybe around this 50% Fibonacci retracement region. And we don’t know the course the market is going to take. But, for instance, we could see something like this develop over the next few weeks where the market does make its way back, chops around, and then starts to push higher again. We get some consolidation moved like that and then get another attempt at rallying into this resistance band.
As I’ve been saying over the last few weeks, I think the play is to incrementally get some exposure to this market. And if we do get a pullback and if we do get a consolidation, that could provide another opportunity just to start getting some exposure on. I’d be hesitant to be adding too much exposure to the ASX 200 at these levels with it just sitting beneath overhead resistance and with momentum looking to be starting to ebb a little bit. I’d be worried about adding too much now. But I think we do need to give the benefit of the doubt this period of rising price action because that could continue to develop into something larger.
And now I want to quickly jump over to the ASX small ordinaries because this has continued to outperform. So, it’s now up. So, over the last month, it’s up 15.5%, which is quite an extraordinary month. But it’s now run into this overhead resistance band which comes in at around 3,020 to 3,080. So, just like the ASX 200, this is a natural place for some sort of pause for this rally to be at least checked. Then we see what the consolidation’s like and what the price action’s like, and then that can help us gauge, does this have another leg higher, or is it going to be a longer period of chop, or is it indeed a bear market rally and something more enormous starts to develop? I’ve been talking about this idea of incrementally adding exposure for a few weeks.
But again, just like I was saying with the ASX 200 with the market being so close to the resistance, I’d rather wait and see. I’d rather see if we get some consolidation and how that plays out. Maybe the market just breaks higher and keeps running. This is why it’s a case of incrementally adding I’ve been talking about this period here. So, it’s not a case of now sitting back and hoping the market falls so you can get on. It’s like you’ve got something on board and now when the opportunities are right, you can continue to add, or if the market reverses, you can retreat and you haven’t gone all in.
Now I want to show you some research that I’ve been doing through the week. Now, this is from my…Let me just find it. Here we go. This is from my weekly report which I send out to members of my Motion Trader service. I sent this out to members on Friday afternoon, and it’s all about my proprietary indicator, the Motion 300. Now, this measures the strength of the top 300 stocks. And it’s got a really good track record of identifying some key turning points in the markets. And if you’d like to read the full report about how it all works and a whole lot of graphs here that I’ve got, if you’d like to look at the whole thing, maybe just come over and take a free two-week trial. You can have a look at the report, have a look at what else I do you might find interesting. I’ll leave a link to the free membership in the comments and the description section below.
So, just explaining what’s going on with this graph, this goes back to 1993. So, it picks up nearly 30 years’ worth of your all ordinaries. This is the all ordinaries here. So, it picks up almost 30 years of market history. And I’ve highlighted seven key areas of focus, seven areas of interest. So, I want to tell you about a pattern that I see when I look at this and I analyze it. So, I’m going to start over here on the left. What you see, when the indicator drops below 50, this becomes a key point where I start looking at this because it means most stocks have now fallen into the bearish territory. So, when the indicator falls below 50, that will come after a significant decline as you can see here. You can see there was a significant decline, and then there is a rebound in the market that causes the indicator to rebound. And then after that, the market falls and makes a new low. And, of course, the indicator will fall off as well. It comes back and re-tests the previous low or maybe even makes a new low. And you can follow this pattern along through these other periods. So, again here there’s a market selloff, there’s a rebound, and another selloff as does the indicator, sells off, rebounds, and comes down again, so the double-dip selloff in the indicator.
So, where are we now? Let’s go and look at where the market is now. It’s fallen to 50, it’s rebounded, it’s double-dipped down below the indicator, and now it’s starting to rally again. So, on that measure, where all ordinaries or the ASX 200 is now, it meets the criteria for a major low as these have all been major lows and they’ve all followed that sequence. So, it’s interesting to look at where we are now but, of course, nothing is clear-cut. Nothing is certain. The market doesn’t work to a script and there are always other possibilities. One of the things…and I was talking about this in the video on the S&P 500, so make sure you have a look at that where I do look at a sentiment-based indicator and I talk about how it’s really important not just to focus in on the areas which suit your view. You’ve got to look at it like a question, where could my view be wrong?
And one of the things I’m aware of, it’s this period here through the GFC. And what we had here, the indicator sold off, it had the rebound, it had the double dip. So, this was potentially the setup for a rally. And indeed, the market did rally, but as we know during the GFC, that was a bear market rally. The market then fell considerably more, indicator turned down, and it basically had a triple dip. And so this goes to show, there can be other scenarios that play out. The conditions are there for a potential significant low. That’s why I say it’s worth, I think, incrementally getting back into the market but we want to have our escape route in case this does turn into something…a deeper correction still, and that remains a distinct possibility.
So, while we can identify patterns, we can consider possibilities, the market’s ultimate course will only be clear in hindsight. So, as I was saying, I think we need to proceed with caution. We need to be flexible with our thinking. So, that means you take a position where you’re prepared to move forward. You don’t just rigidly sit on the sideline and say, “This is a bear market rally. I’m not getting in,” because what if you’re wrong? What if it’s not a bear market rally? That’s why I think we incrementally get back in. We’ve got an escape plan if it pans out to be a bear market rally, but if it’s something bigger, well, at least we started to move back into the market.
Please see video for more details analysis and charts
Looking for the best ASX stocks to buy now?
Motion Trader‘s algorithms scan more than 2,000 ASX stocks daily in search of medium term investment trends. We then tell our members precisely when to buy shares. And most importantly, we tell them when to sell.
Try a no obligation FREE 14-day trial of Motion Trader, and see what an algorithmic trading approach could do for you.
Meet Jason

I'm Jason McIntosh, the creator of Motion Trader. My career began in 1991 on the trading floor at Bankers Trust. Nowadays, I trade my own systems from home in Sydney.
Motion Trader is for investors who value robust analysis, data driven entry and exit signals, commentary, and education. I use engineered algorithms to identify when to buy and sell ASX stocks. No biases or guesswork, just data driven signals.