Is a Bear Market Rally Over | Episode 63
Where is the Stock Market Heading?
00:00 Intro
01:00 Gravity catches up with SP500 (what next?)
02:23 An SP500 pullback could look like look like this
05:45 This indicator points to a new bull market
09:56 ASX stalls at resistance (what next)
11:25 Uranium rallies off support (is a big rally starting)
13:25 Keep an eye on this copper ETF
Transcript (abridged)
Please note: Charts available from video
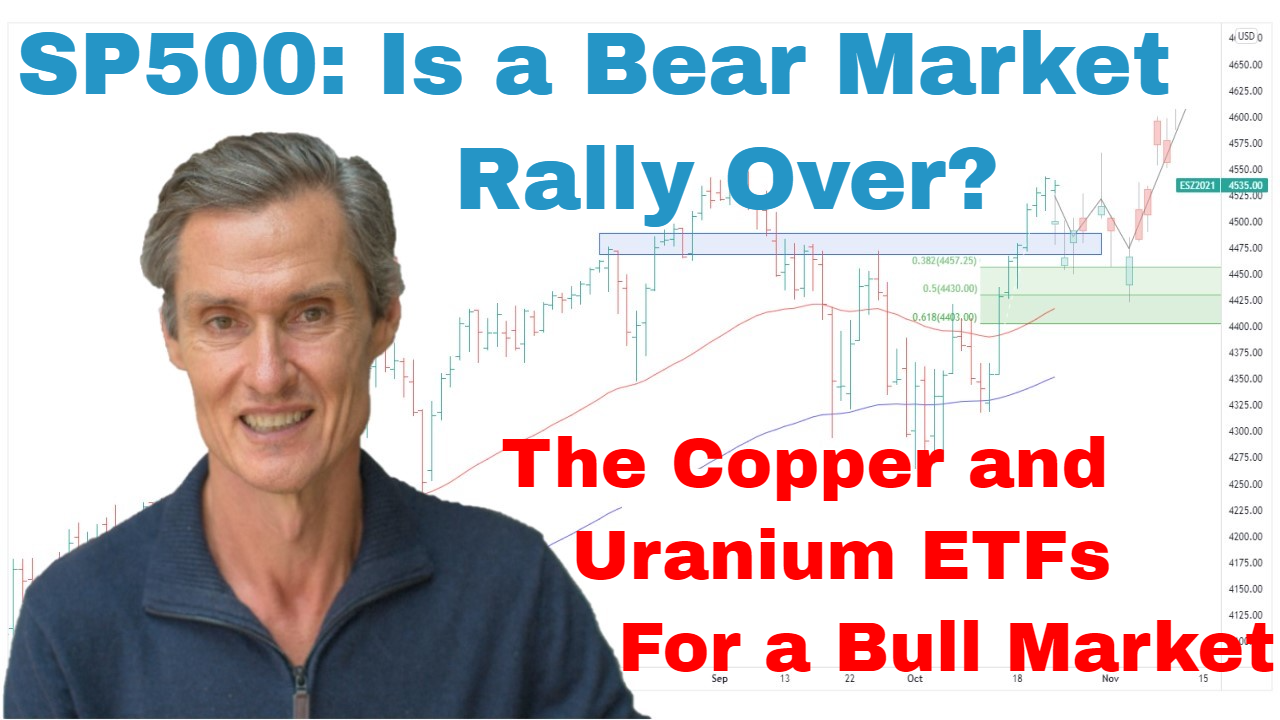
Let’s start with the S&P 500. If you were watching, you’d know that we were talking about the potential for the market to come back and retest these moving averages. So, this is the 50 and the 100-day moving average. Because that’s quite a common event after market turns up from after a selloff, breaks above the moving averages. Gravity has a way of quite often bringing the market back for a retest. And that’s what we’ve been seeing in the S&P 500 and across the equity markets, generally. We’re seeing that in the NASDAQ, in the Russell, the Dow. They’re all doing the same. You see the same pattern in the international markets as well where we’ve got similar price action.
The key to this chart is that we want to see how this pullback unfolds because we’re going to see one or two things happen. We’re either going to see the market start to set up for another push higher, or it’s potentially going to build some new topping pattern and then start to roll over and head down towards this June low, towards a retest of the June low. Too early to say which way this is going to go as yet.
So, first thing to do I think is to put on the Fibonacci retracements. And I’m going to measure from this point here because I think this is a complete leg through there. There’s always a bit of discretion about where you put the Fibonaccis. We could use this point down here, for instance. Doesn’t make a great deal of difference, but I’d prefer to use that. I think that looks like a better complete move to me. Looks like an impulsive five waves, wave one, two, three, four, five, if you like a bit of Elliott Wave. So, that’s why you’d use that as a complete run.
What we have when we do that is this initial move has come right back to the top of the Fibs to the 38.2%. Ideally, for the bulls, the price action we’d want to see develop would be something like this where it chops around a bit, comes back, maybe tests a bit lower, maybe gets down towards that 50% mark. But then from there, we start to get some positive upward momentum. That would be the best-case scenario I think for the bulls. And what makes that such an attractive bullish scenario is it makes the next upward leg…if that’s what we get, it makes it more sustainable by building a platform at this new higher level. We don’t know whether that’s going to happen, but that would be I think the nicest-looking price action for a sustainable bullish move.
The opposite to that would be if the market really does start to stall out and starts to break below these Fibs, then we start looking at the bearish scenarios, which would involve a retest, potentially a break of this June low. But it really is too early to say. It could take a week, two weeks, could take several weeks just to see what happens in this area here.
I’ve been talking about incrementally getting exposure to this market over the last six or so weeks. That remains the case. I don’t want to be all-in bullish at this stage because I still think there’s a real risk that this is a bear market rally, so do a whole lot of other people, which makes me a little bit nervous about that scenario. So, it’s a case of lots of people looking at it being a bear market rally, but just keeping an open mind, I think, keeping an open mind to bullish scenarios which could develop. Because my worst-case scenario in all this is that this does turn into a sustainable rally and being left on the sidelines watching it goes high with no position. I’d call that a worst-case scenario. So, that’s why I talk about incrementally getting exposure. If it’s a bear market rally, we’re not too wrong. We don’t lose too much. We have exit strategies. If the market keeps rallying, well, then we’ve got positions.
Now, I just briefly, a couple of other things. Actually, I’ll jump over to a different chart. I’ll jump over to the ASX 200. Same scenario as the S&P 500. We don’t need to stay on this too long. This big resistance band at around 7100, 7200. Market was stalling beneath there last week, had its pullback to the moving averages. That’s the bare minimum, I think, for consolidation, but I suspect that we’re going to probably see another retest, probably see some more work. We will see what that work looks like and then gives us a better idea of whether the market’s going to be gearing up for a punch through this resistance or whether this resistance is going to continue to cap the market. So, we need more price action, but like the S&P 500, there is a bullish possibility there.
The ASX small ordinaries, same thing. It hit this resistance band a week, week-and-a-half ago at around 3100. It’s pulling back. Let’s see how the market consolidates. If it consolidates constructively, then we start looking for the market to punch above there, but we need more information. As I keep saying, if you’ve been incrementally getting some exposure through this period here, now is a wait-and-see, see how it consolidates. If it punches through, then maybe add some more exposure. But if it starts to break down, or maybe it’s a case of cutting back. So, let’s just wait and see how that goes.
Now I wanted to quickly look at uranium because really interesting in uranium through the week in that we got quite a strong move with the announcement that Japan is looking to restart its nuclear reactors. Big bounce off this support zone at around $13. Too early to say whether this is the upward trend resuming, but all this through here, it all looks very much consolidative, very much corrective, and it looks to me like there’s a big potentially multi-year trend in the making.
Just quickly looking at the weekly chart, why I like this, you look back to 2007, big bear market then a big grind sideways. Now we’re getting the markets rounding higher, but these multi-year moves don’t happen in months and they don’t happen in a straight line. They take time. They move up then they ratchet along or grind along sideways, they consolidate, and then they move up for another leg. That’s what I think is going to happen in uranium. The timing is always uncertain. This could just be a short burst higher, get some people excited, then it could just be back into the grind for many more months. But I do think the big upward move is there. I think that’s where the balance of probability is currently favoring.
My preferred play is the Sprott Uranium Miners ETF, ticker code URNM, listed on the New York Stock Exchange. Good way to get exposure to a portfolio of uranium stocks rather than picking one and you get the right one, you get the wrong one. This one almost guarantees that if uranium does well, you do well also.
And lastly, I’m just going to wrap up on a word on copper. I’ve been keeping an eye on the Global X Copper Miners ETF, U.S.-listed ETF, ticker code COPX. I like this because it seems to be getting some positive momentum starting to develop off this low back in July. And we’re starting to see a series of higher highs and higher lows develop with another break to a new high just last night. It’s coming up to a resistance band around 33. Going to be interesting to watch it here. The moving averages haven’t turned higher. It’s still below the 50-day moving average. This is the one where you could dip a toe in the water to see whether this is developing if you wanted to be a bit more aggressive in getting copper exposure. Alternatively, we wait and see where this resistance breaks because this could be the point to be adding copper. People adding up around here. It was all like the big move was already in place. You had to wait for the big consolidation. The big consolidation has been happening over the last 12 or so months. Things are getting interesting again.
So, I’m going to leave it there for this week. Hopefully, that’s been interesting. Now night time in Adelaide. Time for me to get up and do some other stuff. But thanks for joining me. Hope you found that interesting. I’ll come back to my usual format next week. Look forward to joining you then. Until then, bye for now.
Please see video for more details analysis and charts
Looking for the best ASX stocks to buy now?
Motion Trader‘s algorithms scan more than 2,000 ASX stocks daily in search of medium term investment trends. We then tell our members precisely when to buy shares. And most importantly, we tell them when to sell.
Try a no obligation FREE 14-day trial of Motion Trader, and see what an algorithmic trading approach could do for you.
Meet Jason

I'm Jason McIntosh, the creator of Motion Trader. My career began in 1991 on the trading floor at Bankers Trust. Nowadays, I trade my own systems from home in Sydney.
Motion Trader is for investors who value robust analysis, data driven entry and exit signals, commentary, and education. I use engineered algorithms to identify when to buy and sell ASX stocks. No biases or guesswork, just data driven signals.