Bullish Break For ASX Stocks (But Watch This) | Episode 87
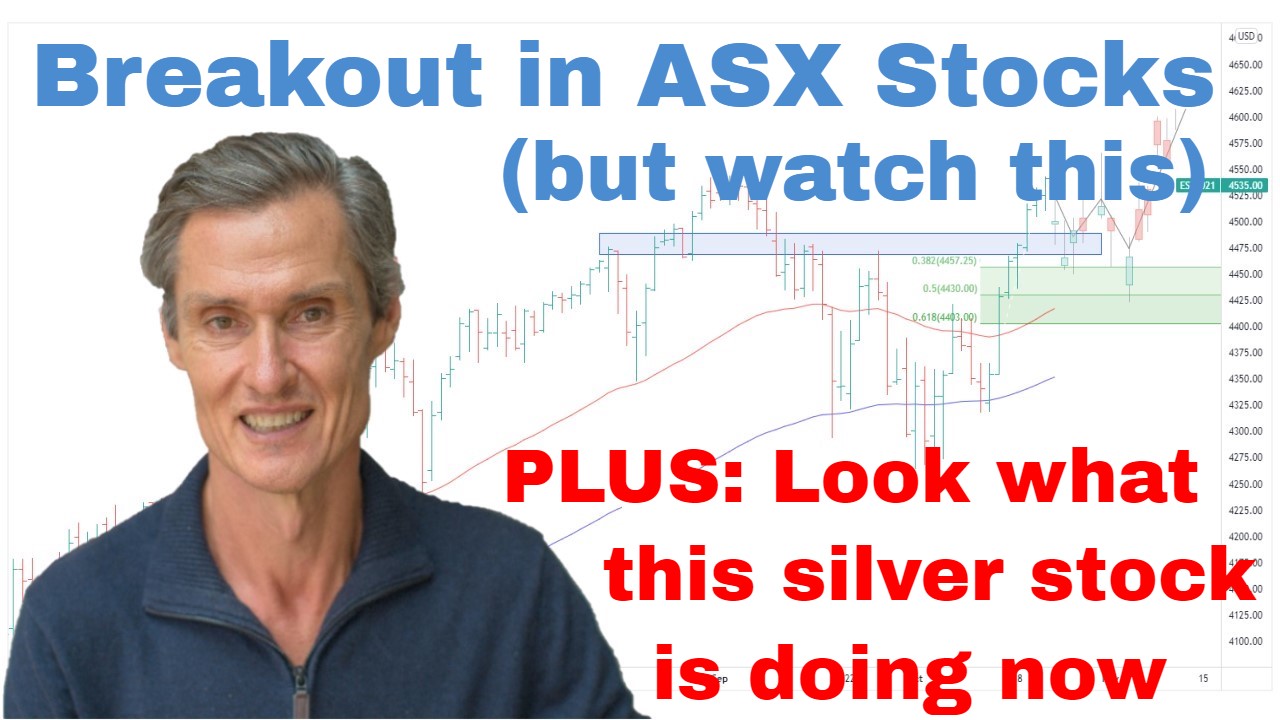
Where is the Stock Market Going?
00:00 Intro
00:32 Positive price action for ASX200 (but look out for this)
04:20 Look what the ASX200 Equal Weighted index is doing
06:11 I’m seeing breakouts like this in individual stocks
10:14 Gold’s price action is following the script (what next)
12:46 Silver is turning higher (look at the set-up in this ASX silver stock)
15:02 US dollar’s latest price action is a key factor for commodities
Transcript
Please note: Charts available from video
We have the ASX 200 up on the screen. And the positive price action has continued to build through the week with the market moving up to its highest level since back in June. So, quite positive in that respect. We’ve also got these moving averages which are crossing and turning to the upside. And as always, I’m using the 50-day moving average being the red one, and the blue moving average is the 100-day moving average. And this is the first time these moving averages have crossed since…you’ve got to go back here to when they last crossed to the upside in around April. So, it’s been a while since they’ve crossed to the top side. And having a market trading above moving averages and also the moving averages trending higher, these are really the underpinning factors of a healthy market. So, it is quite encouraging that we’re seeing this price action in the ASX 200.
Just like you’ve seen my video on the U.S. market because I talked about the Dow and I talked about how the Dow is quite extended above its moving averages. This is the case for the ASX 200. We just look at how quickly it’s run above those averages, and I would describe this now as being quite stretched above the moving averages. So, I think that opens the window for some consolidation, for some sort of a pullback towards the moving averages over the coming weeks.
I’m also aware of this resistance band that the market is now… It’s at the upper reaches of. It’s getting close to getting through it. You can see this resistance band. It’s around 7200, dates back to around May 2021. And it’s not a perfect fit as we’ve got these instances where it’s shot to the top side or above that shot through the resistance band a little bit here as well. I’m going to tell what we do here whether this actually does provide the resistance to get a reaction to the downside or whether the market does, in fact, continue onwards and upwards. I don’t put a high probability that we’re going to continue upwards unchecked. I think the market does need to consolidate this rally we’ve had from the low which has been quite an extended rally now.
And in terms of entry points, as I’ve just been saying with the extent this has extended above the moving averages, I just don’t think this is an asymmetric entry point to be buying the ASX 200 index as like say through an ETF. I don’t think it’s an asymmetric entry point. By that, I mean an entry point where your upside is greater than your potential downside. I think the scope for a pullback is just increasing now that I just don’t like here as an entry point for a fresh position.
When I look at this chart, this could all be part of a big basing formation. And the longer these bases take to form, the stronger they often become, and that can sustain a larger rally as we move into the months to come. But it’s a case of being patient with these. We shouldn’t extrapolate this move we’ve had over the last couple of months into the next couple of months because, as I say, moves need to be checked. Nonetheless, the price action is looking encouraging. It’s certainly looking like encouraging price action.
Another thing which is worth looking at is ASX 200. It’s a market cap index. So, the big stocks generate most of the movement, so BHP, Rio, the banks say dominate the index movement. Interesting when you look at an equal-weighted index, so where the biggest stock has the same weighting as the smallest stock in the top 200. So, this is ASX 200 equal-weighted index. And what I like with this is we’ve got a breakout. We have a breakout above a three-point downward trend line and the moving averages are starting to turn higher. Haven’t crossed yet, but they’re looking close to it. So, this rally we’ve seen, much of the ASX 200’s resilience over the last six to nine months has been through the banks and the big resource stocks. And some of those smaller stocks have been hit quite hard.
What we’re seeing now by looking at this equal-weighted index is that we’re seeing across-the-board rebound in a lot of stocks across a lot of sectors. So, I think that’s really interesting. I think it’s positive. And what I’d like to see now is maybe some consolidation. Just consolidate that break out. Just have the market track sideways for a period of time, whether it be several weeks or so, and then from there, maybe then that provides the setup for the next leg higher. But we just need to see. Let’s just see how this price action develops following the breakout.
And I’ll give you an example because I’m seeing lots of buy signals for the stocks across a range of sectors in just over the last…probably maybe the last three or four weeks. I’ll give you an example. This one turned up I think it was three weeks ago. Its ticker code is ARX. What it is, it’s a regenerative medicine company, market cap of about $360 million, so it’s in the all ordinaries but it doesn’t make the cut for the ASX 300. And it’s an interesting setup when we just have a look at it. And I’m finding stocks like this through momentum analysis. So, that’s what I use to be able to sift through so many stocks and find these smaller ones because I had no idea this stock existed until it turned up in the momentum scans. And then I’m using risk management strategies to trade them over the medium term, so potentially over the next maybe one to two years if the trend develops. If it doesn’t, we’ll cut it and move on to the next idea.
But there’ve been an increasing number of stocks like this, and this is where they’re breaking out from basing formations and then potentially entering into new upward trends. So, just going through this chart. We’ve got this double-bottom support that comes in at… You can see down here around 62 cents we’ve got a double bottom. So, that’s a double-bottom support. And so these basing patterns, they take time to form. It’s not about the market sells off, when do I buy? You got to wait for the base form. And this one has taken several months. So, we’ve got this basing pattern. We had the initial move up in June into an August high, then we went into another consolidation. And I’m drawing it in here. You got a triangle-type contracting range. And during that period, it led to the moving averages starting to turn higher. We’ve got a breakout from that range, the moving averages have crossed, the 50-day is above the 100-day, so you got those underpinning criteria that lead to upward trends. The breakout was followed by another consolidation because you often get a consolidation after a breakout from a range, and then we’ve had another breakout again. This is where my Motion Trader momentum analysis picked it up on this second breakout once the moving averages had crossed, got a breakout to a new high point. That was a signal.
We’ve had a bit of a run since then. So, just like I was saying with the ASX 200, this stock has now extended above the moving averages, so it does open the possibility that we do get some sort of a pause and a pullback into consolidation, maybe a new base, and then from there, maybe that sets up for another move higher. Who knows whether that’s what the price action will look like? But that’s price action that you often see in this type of situation. So, that’s what I’ll be looking for. Will it be bought on dip? Will that help create a new base? This is all the stuff that we look for in working out which of the stocks offer the higher probability and which are the ones to avoid. The ones to avoid, of course, are the ones that are trading below their moving averages. And so lots of stuff, lots of interesting things like that on the go on the moment. So, overall, price action is looking positive in I think across the ASX 200, then across a number of the stocks when you start to dig deeper into them and look at what the setups are like.
Now, if you’re getting value from this, please hit that like button, please leave a short comment, just “Hey, thanks for the video. It just tells YouTube that people are watching, people are engaging, and then YouTube shows more people. And that’s what it’s all about. I make these so they get watched, and they only get watched if YouTube pushes them out there. So, please do that. It helps me heaps. If you haven’t already, hit the subscribe button on the YouTube channel to tell YouTube you want to be a viewer, and visit me at motiontrader.com.au and see the stuff I’m doing over there which, you never know, might be able to help with how you are managing your own portfolio.
Now, I want to move along and have a look at gold because gold is looking interesting. So, here we go. Here’s the gold chart. And we spoke about this last week. Last week, I was talking about how we had the breakout from this downward trend channel that had been in place since the March high, had the breakout. This week has been quite constructive. So, last week, you might remember I was talking about the possibility that we’ve had that initial move, we’re above the moving averages, maybe we get some sort of a pullback, some return move. And that’s what’s happened because it’s just a quite typical price action. There’s nothing amazing in suggesting that and seeing it happen because it happens quite often. It’s one of those things that we look for. We look for return moves after breakouts and initial moves above moving averages.
So, we’ve had this pullback. It’s come back to the moving averages. We can actually even put some Fibonacci retracements on and just have a look at what that shows. And that’s interesting, too. So, look at that. It’s come right back to the 38.2%. So, so far, it’s a shallow pullback, which is encouraging because it shows there’s underlying strength in this market. It’s buy on dip. There is interest in buying this stock, buying the gold market on the pullback. So, they’re all positive things that we want to see their constructive things in what could be developing as a new period of rising prices. And it’s possible this continues to consolidate for a little bit longer, but I think the overall situation is starting to look good. In fact, I think this is the best gold has looked since back in February, back around mid-February when prices broke out of this consolidation which we had. I spoke about months ago. I spoke about that back at the time, but this is when gold was looking interesting. Didn’t follow through, it fell back down, went off the radar for quite a while once it got below those moving averages, and it’s been a case of just okay…
It don’t matter how much you like the longer-term picture. Once your short-term picture is below the moving average, it just says now is not the time. Put it on the back burner and walk away, look at other opportunities until it’s time. It’s looking interesting again. It’s back above the moving averages. The moving averages are starting to turn, so now is the time to start looking at it. This was a period to do other things. This is the time to now start paying attention.
And interesting when I look across at silver. It’s a similar setup in silver in that we’ve got this rounding basing formation, moving averages are close to crossing. We’re consolidating after the initial break above the moving averages. So, keep an eye on silver because I think that’s an interesting one to be across. It’s not as widely followed as gold, but it can be some interesting opportunities. Just by chance, I was having a look at a stock called Silver Mines earlier today. And it’s a small stock. It’s a small ASX stock. Its ticker code is SVL. It’s speculative. This one won’t turn up in my Motion Trader signals because it fails the volatility test that I run across my signals. I want to keep out stocks which are displaying too much volatility. But there can still be some interesting opportunities for people who are comfortable with extra volatility.
Let me put on some moving averages onto this as well. So, I’ll just put the 50 to 100-day moving averages on. What’s interesting here is, following this sell-off period, we’ve got a V-shape recovery, that classic V-shape recovery. From there, we went into a sideways trading range, this contracting triangle. It’s actually called an ascending triangle. So, the lower boundary is rising while the upper boundary is flat. The theory is that’s showing the accumulation, buyers are paying more and more to get into the stock while the selling is fixed. And what’s happened now is this sideways range has allowed the moving averages to turn higher. We’ve crossed just last week. We’ve had a breakout of this range.
What’s also interesting is to just throw a volume study on, and you see that the breakout has been accompanied by a surge in volume. So, it’s going to be really interesting stock to watch, just see how this pans out, whether you’ve got the classic technical pattern and the breakout on volume. Let’s just see. Let’s see whether it continues to rise. It could be a sign for the silver and commodity markets, in general, that we are seeing that positive price action. And I’ve been speaking about the gold stocks over the last few weeks, so interesting to have a look at a silver stock.
And just lastly, I think the key to all this is this U.S. dollar. This is the U.S. dollar. Over the last couple of years, we’ve had this relentless upward trend. Price has been consistently above those moving averages. What we’ve seen in the last couple of weeks is that these moving averages are now starting to turn over. They’re close to crossing to the downside. The dollar broke below a short-term support level a couple of weeks back. What’s significant now is price is now below the moving averages. If you’ve been watching my stuff for a while, you know that I say all the bad stuff tends to happen below the moving averages.
The US dollar is now technically vulnerable. It’s in a weakened state, and if the U.S. dollar remains in a weakened state, it becomes a positive backdrop, a positive tailwind potentially for gold and silver and those gold and silver stocks. So, there’s been quite a bit of technical damage here. This could well be a medium-term type top. I don’t have a strong longer-term view on this at the moment, but let’s just see how this medium-term picture plays out. And at the moment, it looks like… It looks like, at the very least, there’s now a lengthy period of consolidation before we can look at this move turning higher. That gives time for gold and silver and commodities, generally, maybe to start showing some strength. So, really interesting to see.
Please see video for more details analysis and charts
Looking for the best ASX stocks to buy now?
Motion Trader‘s algorithms scan more than 2,000 ASX stocks daily in search of medium term investment trends. We then tell our members precisely when to buy shares. And most importantly, we tell them when to sell.
Try a no obligation FREE 14-day trial of Motion Trader, and see what an algorithmic trading approach could do for you.
Meet Jason

I'm Jason McIntosh, the creator of Motion Trader. My career began in 1991 on the trading floor at Bankers Trust. Nowadays, I trade my own systems from home in Sydney.
Motion Trader is for investors who value robust analysis, data driven entry and exit signals, commentary, and education. I use engineered algorithms to identify when to buy and sell ASX stocks. No biases or guesswork, just data driven signals.