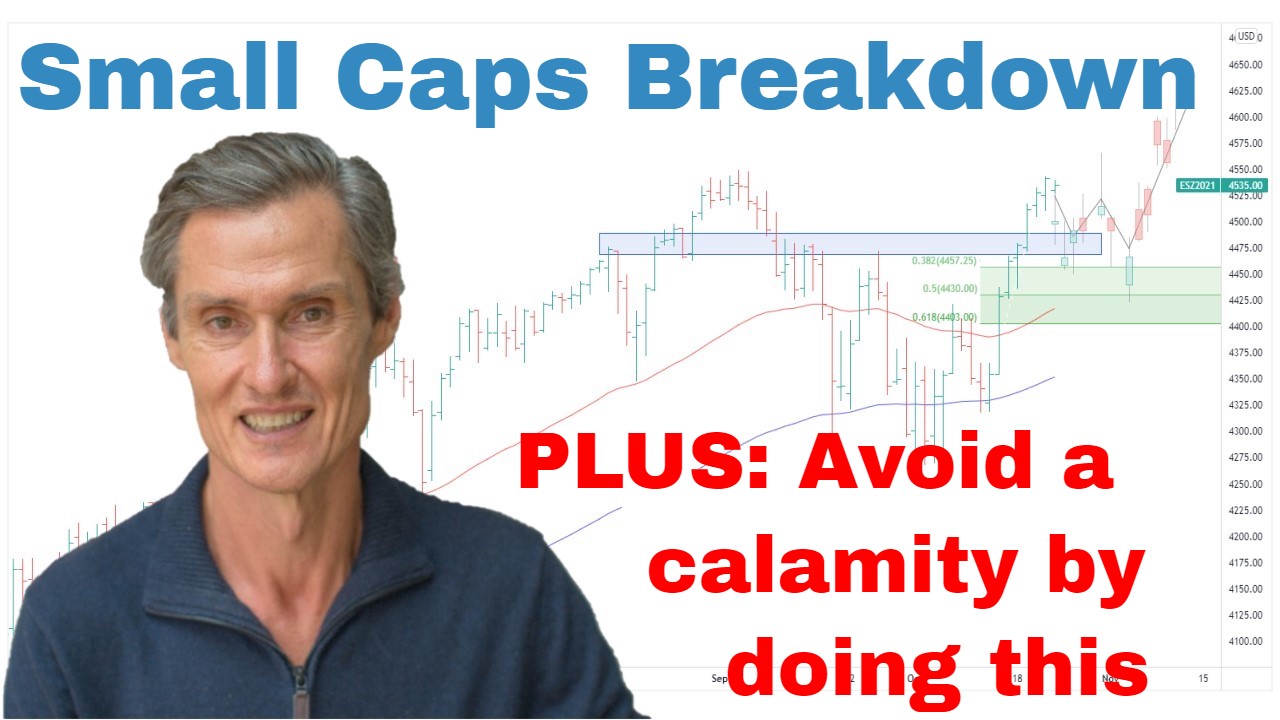
ASX Small Caps Breakdown | Should You Buy | Episode 116
Where is the Stock Market Heading?
00:00 Intro
00:28 ASX 200’s correction intensifies (what next)
02:53 Small caps break support
03:34 Most of my portfolio is in these stocks (this is what I’m doing)
09:02 Can gold keep running?
10:43 Don’t argue with this price action in copper
11:32 Uranium disappoints the bulls (but will it recover?)
13:10 The best advice I ever got about markets
Transcript
Please note: Charts available from video
This video is going to focus on the ASX 200. I’m also going to have a look at gold, copper, and uranium, so make sure you stick around for that. I’m going to cover the S&P 500 in a separate video, and I’ll leave a link for that in the description section below. As always, this is general commentary, it doesn’t take your personal situation into account. With all of that said, let’s get into our first chart.
So, here we go. We have the ASX 200 up on the screen. And the ASX 200 remains very much in corrective mode. And the correction has actually even accelerated since when I spoke last Friday. So, I’ve been saying for several weeks now that I didn’t think there was a hurry to do much, and that remains very much the case today. For me, that means holding onto the profitable stocks I have in my portfolio and selling those that are hitting their exit stops. And other than that, there’s not really a great deal which I think needs to be done. I’ll talk a little bit more about that in a moment.
And the ASX 200. So, just looking at the price action over the past week. ASX 200 is now quite stretched below these moving averages. So, it’s been a sharp fall to the downside. It’s come right into the Fibonacci range. So, I’m measuring the Fibonacci zone which is this shaded area, blue-shaded area in the middle of the graph. I’m measuring from the September, October low, through to the February high. That gives us this Fibonacci region. And we’re right back down around the 50% mark. So, if you’re going to get a bounce in a market, this is one of those classic places where it often occurs from around the 50% Fibonacci when you’re stretched below the moving averages. So, it’s going to be interesting to watch over the next week because this would be that natural place to get some sort of a rebound.
And regardless of whether or not there’s a bounce, as I’m saying, I’m not in a hurry to buy. If we do get a bounce, I want to see what that bounce looks like. Doesn’t look like it could be the start of the stepping stones to something which then could continue back up towards 7,400, maybe beyond. Or doesn’t look corrective in nature, which could then break down to even lower levels. So, we need to see. We need more information. We need to see what a potential rally could look like. And at this stage, I’m happy just to… I look at this and this is just, at the moment, not a dip that I currently want to buy.
I want to go over and have a look at the small caps, ASX small caps because this price action has deteriorated as well over the last week. I was saying last Friday that it was looking worrying in that it had been sitting below these moving averages for a couple of weeks. That’s always when a market becomes vulnerable. And sure enough, it’s been vulnerable. It’s fallen towards support at around 2,700. And it’s actually now broken below that support as I film this on Friday afternoon at about 1:45. So, that deterioration of the price action is a concern.
Most of my portfolio is in smaller stocks. So, this is a part of the market which I keep a close eye on. Just to give you an idea of the things going on in my portfolio. Now, this is one stock. This is a stock which actually I no longer have in my portfolio which I sell because it hit its exit stop. It’s biotech. PIQ is the code. And so, I bought it somewhere around late January. The moving averages crossed, the price broke to a new high. That’s a classic characteristic of a stock that has the potential to trend higher. But, of course, not every stock will trend higher. This one quickly lost momentum. And then coupled with the market sell-off that we’ve been having, it’s accelerated to the downside. Hit my stop loss on Friday. I sold first thing Monday morning. I got out at 80 cents. Not long after, it fell down and got down around 60 cents.
So, that just shows the danger of… It shows one of the risk factors that someone needs to consider when considering small caps because they are prone to oversize falls when liquidity dries up, when markets fall suddenly, or if there’s an event within the company itself. They can be harder to get out of. So, that’s why I have a many small trades approach rather than large concentrated bets on individual stocks. Just means I’ve got more maneuverability to get out of a stock like this.
And that said, that is one type of stock which I’ve seen move through my portfolio in recent weeks. But then there are other ones like this, Acrow Formwork, ACF. So, this is where I bought. I bought this back in August 2022. Moving averages have crossed, broke to a new high, signs just like PIQ which didn’t work out, same characteristics but had a pullback initially, but then the trends engaged and there’s been some really strong gains in this stock. Look at this. Trading today with the market down is almost at a new all-time high. So, I watch a small cap index but I also look at the components. The index contains a lot of rubbish which is trending lower and not in good shape, not in the shape you want to be investing in. What I try to do, I’m cherry picking what appear to be the most higher potential parts of that index, and this is where you can get some good moves.
Just quickly another stock, Duratec. This is where I bought. Like Acrow Formwork, it’s up near a 52-week high despite the small ordinaries being down something like 20% to 30% thereabouts over the last year or so. So, the reason I show you these two charts is that, for me, whilst the market is volatile, it’s difficult, and large parts are trending lower, for me, it’s not a case of sell everything. I find that this smaller end of the market, it gives the greatest scope for mispricing, largely because… Who’s heard of Duratec? I hadn’t heard of it until I got a buy signal, until it was picked up in my daily scans.
And that’s what I’m doing with Motion Trader. That’s what it’s all about. I’m also looking at the big stocks, but where I find it’s most interesting is when I run the algorithms over the market, it’s picking up stocks like this which I’d never heard of. And as I was saying, the small caps, that’s where I think you get the greatest scope for mispricing in these oversized gains. So, after selling a few stocks like PIQ through the week, I’m probably around 40% cash at the moment. We’re just going through one of those… We’re going through one of those really difficult periods where there’s no… There’s actually been no dominant trend since June last year. This is a large whipsawing sideways movement in the small ords. So, that’s what? That’s eight or nine months of really difficult conditions coming off the back of a steep decline. So, this is why risk management and being cautious is just so important.
I’m conservative in the way I approach the markets, and I’m not going to be trying to pick low points. I think picking low points is dangerous, and it opens the risk that you try and pick a low point, bottom drops out of the market. I’m not suggesting that’s going to happen, but I’m not going to put myself, expose myself to that risk. I want to stick with stocks in uptrends, get out of stocks which are breaking lower, and then I’ll wait for the price action to suggest the ords are moving back in my favor.
Now, if you’re getting some value from this, please hit that like button. Leave a short comment. Just tells YouTube you’re watching, that you’re engaging. They’ll then go and show other people. And that helps me a lot. And please subscribe if you haven’t already done so. Come and visit me at Motion Trader. See whether this trend analysis type stuff could help with managing your own portfolio and also finding some interesting stocks.
Now, let’s jump to some commodities. Gold, the first one. Now, since speaking last week, gold, very interesting. Gold pulled back to the moving averages. And I didn’t note that last week, and I think I said, “This is where you’d find buy the dip,” but I said, “There’s just no momentum. There’s no hurry to do anything.” But with all the stuff which has gone on with banks through the week, we’ve had a spike in interest in gold. So, it’s conforming to that overall medium to long-term view that seems to be shaping up quite well.
What to do now? Well, for me, it’s a case of I continue to hold the gold stocks which I have. I haven’t been adding in recent times, in recent weeks. I’m not going to add here now. This is now getting… Maybe gold could continue to run a bit further over the next week or two. The issue it has then, it starts to become stretched above these moving averages again just like we saw back in late January into early Feb, and that can then lead to a pullback. Maybe it’s a case, and this is just complete speculation because, of course, I don’t know. Maybe we see gold move into some sort of a trading range. Maybe it can break to the top side, maybe. I don’t know. We need to watch, we need to wait and see how the price action develops. But this is why I say sometimes it’s best to be in no hurry. You just don’t have to do something all the time. This is a price action where I’m happy to wait and just watch what happens, see what develops over the next several weeks.
Turning to copper just briefly. I got a breakdown below this support at four dollars, below the moving averages. From a medium-term perspective, I still think this could still be like the early stages of this market turning higher, but I’m not going to argue with the break of support and with it sitting below the moving average, especially while we have so much global volatility going on. So, for me, now copper is just a watch, it’s a wait. I like the copper ETFs, which I’ve spoken about in the past, and copper stocks. But probably not in a hurry to do anything whilst we have this price action. I’m going to trade with the momentum, not preempting momentum potentially turning around.
And on preempting, moving to uranium. So, uranium has fallen right back smack-bang in the middle of this big range which has now been in the scenes going back to September 2021. There’s been so much interest in uranium over the last 18 months and it’s just gone sideways. I think there’s still a terrific medium to longer-term story there, but it just goes to show these things take time. It’s like we get these ideas and it’s like, well, it has to go to the moon tomorrow. It doesn’t work like that. We get big upward moves, initial moves, and then you get the big grind sideways, the sandpaper move sideways where it just grinds people out of the market and they get fed up. And this also shows why I don’t like preempting a breakout.
Now, you may remember maybe it was about three weeks ago I pointed out, the uranium, it’s rounding up. It’s above the moving averages. The moving averages are trending higher but resistance. So, I don’t want to buy just beneath the resistance point. It’s not an asymmetric setup. I’d rather buy the break, but the break hasn’t come. So, anyone preempting the break, they’re now sitting with this pullback. Maybe it’ll stabilize, maybe it will move up later in the year. I don’t know. Nobody knows. But just a lesson in respecting support and resistance, don’t make big bold moves just beneath the resistance points. Wait for the breakout. I know it’s tempting to get in at a lower price, but the price you pay if you’re wrong is you’re stuck in something which is lower level.
Now, just before I wrap up, I just want to say a quick word on a couple of these banks. Credit Suisse. Turned on the news on Thursday morning and the first headline was “Credit Suisse Down 30% in a Single Day.” And that seemed like, wow, this is huge. What’s happened here? Look at the chart, though. This goes back to 2021. For the last two years, this stock has been in a relentless downtrend. The moving averages turned lower in April 2021. Since then, there’s been absolutely no cause, from my perspective, from a trend-falling perspective, to buy this stock. Yes, of course, for every seller there’s got to be a buyer, there’s been plenty of people who have been buying all the way down.
And it just goes to show these situations are completely avoidable. It shouldn’t be shock horror that it’s accelerated to the downside. When a bank stock trends lower for two years, something is wrong, and chances are there’s going to be something nasty is going to come out of the cupboard. And sure enough, there’s trouble at Credit Suisse. No great surprise there. So, just respect these moving averages. I think they’re a really good guidance system for a portfolio generally. When something is below the averages, it’s trending lower, I don’t think it’s a stock that…well, certainly not a stock I want in my portfolio. And once in there, it seems to be a good cause to look long and hard. Why is it in there? Should it be leaving?
And also with this Silicon Valley Bank. Again, shock horror when it collapsed. And, of course, a bank collapse is an extreme event. But again, look at the share price. We had fourth-month decline before the wheels completely came off. When a bank falls as much as this did, so what’s that? That could be a 70% fall. It’s not… Let me just actually measure that. So, how far did it fall from? It’s down 74%. So, when a bank loses 74% of its value in a year, clearly there’s a problem. So, technical analysis can be really helpful for helping you avoid calamities where the wheels come off. Look at these moving averages, 50, 100-day don’t fight the trend. I think that’s the best advice I’ve ever been given, and, hopefully, I can give you. There’s a time for getting in, but it’s getting in when the trend is in your favor. Preempting turning points can just leave you with a lot of disasters in your portfolio which you really don’t want that. Hopefully, that’s been helpful. Thank you for joining me. I look forward to coming back and talking to you next week. Until then, bye for now.
Please see video for more detailed analysis and charts
Looking for the best ASX stocks to buy now?
Motion Trader‘s algorithms scan more than 2,000 ASX stocks daily in search of medium term investment trends. We then tell our members precisely when to buy shares. And most importantly, we tell them when to sell.
Try a no obligation FREE 14-day trial of Motion Trader, and see what an algorithmic trading approach could do for you.
Meet Jason

I'm Jason McIntosh, the creator of Motion Trader. My career began in 1991 on the trading floor at Bankers Trust. Nowadays, I trade my own systems from home in Sydney.
Motion Trader is for investors who value robust analysis, data driven entry and exit signals, commentary, and education. I use engineered algorithms to identify when to buy and sell ASX stocks. No biases or guesswork, just data driven signals.