ASX Nears Key Level: Plus Gold & Copper | Episode 95
By Jason McIntosh | Published 23 December 2022
Where is the Stock Market Going?
00:00 Intro
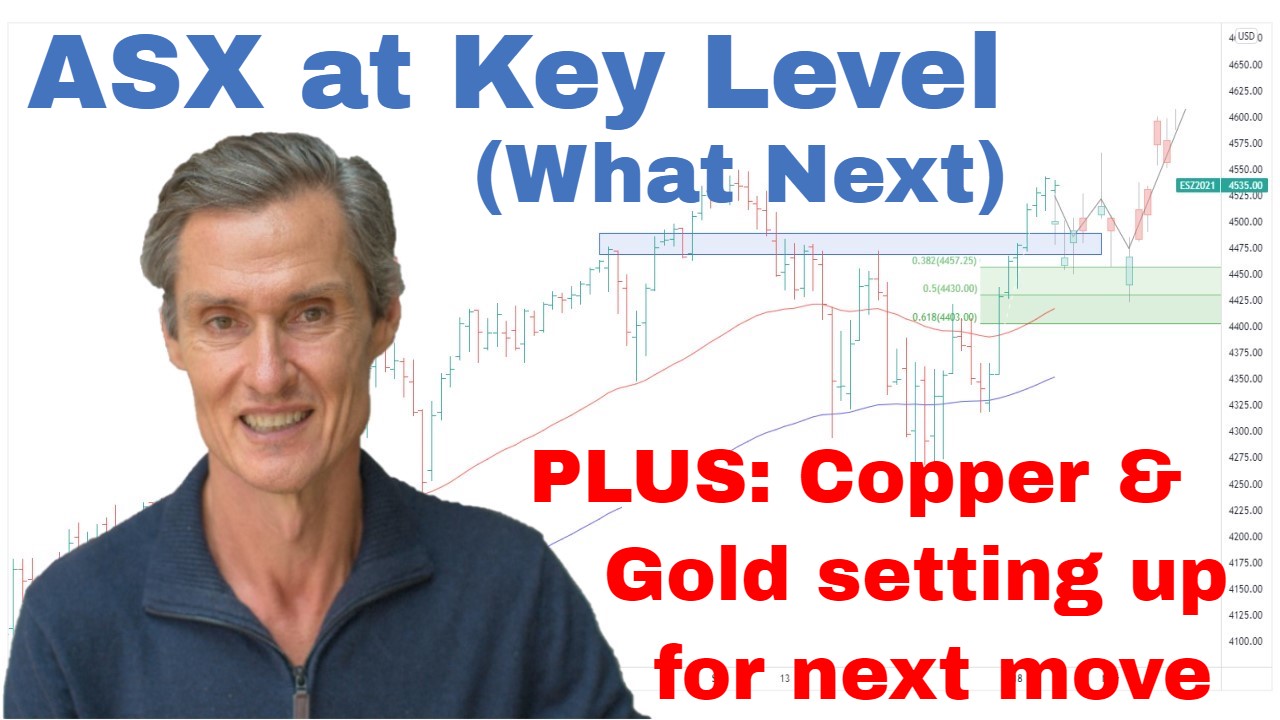
00:30 ASX 200 pulls back to target area. Look for this next.
02:50 ASX Equal Weighted index crossing a key level
05:05 Last change for the Great Christmas Special!
05:23 Is this the chance to buy gold?
06:24 Look what the world’s biggest gold stock is doing
07:44 Copper preparing for a big move
09:05 Is this the best copper play for investors?
10:43 You have to see this graph (especially if you’re bearish)
Transcript
Please note: Charts available from video
This video is going to focus on the ASX 200. I’m also going to cover gold and copper. I’ll cover the S&P 500 in a separate video, and I’ll leave a link for that in the description section below. I’ve also got a fascinating graph for you, so make sure you stick around for that. I think you’re going to really like it. And as always, this is general commentary and doesn’t take your personal situation into account. With all of that said, let’s get into our first chart.
So, here we go. We’ll start with the ASX 200. And really this week has been all about a continued pullback in the ASX 200. It’s continued the pullback that we’ve been talking about pretty much for the last month now. Very similar story to the Dow Jones in that the ASX 200, it got well above these moving averages after just crossing above it. And it’s been a case of the market needing to pause and consolidate. And that’s so often what we see happen when a market does get stretched above those moving averages. Moving averages, as I often say, they work like gravity, and a market tends to pull back towards them. And what we also see is the market’s come back to the 100-day moving average. So, that’s pretty much what I think would be…is textbook pullback at this stage.
And what I want to do also, I want to put on some Fibonacci retracements because they’re always interesting to have a look at. Just measure out from the October low through to the recent high. And we see that the ASX 200 has come pretty much back to the 38.2%, so right to the top of that Fibonacci region. And so again, what you’d expect to see in a market that’s consolidating is room for more consolidation and room for it to pull back a bit further. It doesn’t look like it’s set up to start running away on the upside at this point. Looks like it probably needs to do more work. But then again, like the Dow, it also doesn’t look like it’s set up for an imminent return to this bearish phase which we’ve seen during the year. It still looks constructive and I still think we want to give this rally from the October low the benefit of the doubt and see whether it can continue to extend in maybe the weeks or the next month or two into 2023. I think it remains a case of watching how the pullback develops and then focusing on individual stocks and looking for stocks with positive setups.
So, let’s also have a look at the ASX equal-weighted index. We’ve looked at this a couple of times over the last few weeks. The significant point on this chart was the breakout from this trend line. We have three points in the trend line, so it becomes a significant trend line that the market has broken above. What’s happened over the last week, though, is… So, this pullback is really starting to get a little bit deeper and it’s now… Equal-weighted index is on the verge of being below the moving averages. It’s not a huge point of concern at the moment, but it is maybe a warning that… We’d like to see this market really start to find support at least around these lows from early this week. So, it came back to the trend line, rebounded off the trend line, but I’d like to see this start to find some support. I don’t want to see this continue down back into the middle of this range that has been in over the last…or really since the June low, this large trading range which has been in. I don’t really want to see it pulling back into the middle of that range.
So, it has lost ground this week and the price action is weaker, so I think it’s a case of remaining defensive with our portfolios and knowing where our exits are if price action continues to deteriorate. For me, it’s a case of holding on to my stocks which have been doing well, they’re holding above their moving averages and considering stocks which are breaking to new highs. Also, holding plenty of cash, which is a key part of my strategy at the moment. And that said, I don’t want to be scared out of the market completely because the worst scenarios just may not play out. But that said, not a time for complacency. So, just know where your exits are. I think it’s a really important time for risk management. It’ll all be okay-type attitude.
Now, if you’re getting some value from this, please hit that like button, and please leave a short comment, just “Hey, thanks for the video.” It helps a lot because it tells YouTube people are watching, YouTube shows more people, and I make more videos. And also, come and visit me over at Motion Trader. Christmas special on at the moment. If you’re on my mailing list, you would have received that Christmas special. If you haven’t, send me an email. I’ll send it to you. It’s a great time to consider getting Motion Trader as part of your investment resources if trend following and price action is something that interests you.
Now, let’s move on and have a look at gold because gold continues to be interesting. And so the big move was, of course, the breakout from this trend channel a couple of months back. And what we’ve seen, what I’ve been talking about over the last few weeks is for the market to pause, pull back towards these moving averages. And that’s what has continued to happen over the last week. Gold has really been stuck in this range as the moving averages have been catching up. There’s certainly the potential for more consolidation. There’s also the potential for gold to pull back and actually retest these moving averages. But overall, I think the price action remains encouraging. The moving averages have crossed, moving averages are trending higher. These are all the building blocks for a potential upward trend. So, gold is doing all the right things. So, I like the way that this structure is coming about.
It’s also interesting to have a look at gold stocks. So, I’ve got a big gold stock to look at. It’s Newmont. This is the U.S. listing. And Newmont is an interesting chart. So, had a false break down in November. Broke down from this trading range that had been in, break down, only stayed down there for a couple of days before rallying back. So, it was a false break, continued up above the 100-day moving average, and now for the last, say, six weeks, it’s just been tracking sideways along the 100-day moving average. And looking at the most recent price action, just like last night’s price action. The market opened, traded lower, and then closed on its high. So, it looks like there’s accumulation going on in Newmont.
And the same applies to large stocks like Barrick as well. I think this is setting up for higher levels. I like the way the Aussie gold stocks are looking as well, but they’ve all had a bit of a run of late, and the potential of a pullback certainly remains. But the overall structure of gold, of gold stocks, it’s looking encouraging. It’s looking the best it has since earlier on in this year.
Now, I also want to have a look at copper. Copper has been traveling along quite well. It’s really now starting to coil up between resistance up and around 4, and there’s support down here at around 360. Really starting to now coil. And I like that the moving averages are crossing, the price is above the moving averages. It does seem to be setting up for another tilt at this resistance at around four. So, whether it’s a case that is getting ready to go up quite soon and retest it or maybe it’s a case that it’s going to continue to de-coil for a little bit longer before, then maybe having a test and breaking above. Of course, maybe it does something else altogether. Maybe it rolls over and heads down. But that doesn’t look like the likely scenario at the moment. At the moment, it looks like it’s gearing up for a break higher.
Now, it’s been a long wait for copper bulls who have been waiting for the next leg since back here in May 2021 when there was a lot of excitement around copper after this 14-month rally, but big rallies always lead to big consolidations. That’s what’s played out. But looks like maybe the launching pad is being built for the next push higher. And looking at it… So, a way to play copper. And you’ve probably heard me talk about this before, is this Global X Copper Miners ETF. This is a U.S. listing I’m looking at. I like the way this is shaping up. It’s interesting that the stocks are actually leading the metal. I prefer it being the other way around, but that’s just not the price action we have. Nonetheless, the price action in the copper stocks is positive, above these moving averages. Moving averages are trending higher.
For anyone who likes to buy the dip., this is shaping up potentially as a buy-the-dip opportunity. Good asymmetric risk-reward where you’re buying not too far above the moving averages, just above a support region. So, it opens a possibility that the price action does start to do something like that. Maybe it requires more consolidation. Maybe it’s going to do some more work before breaking upwards. Maybe it requires a copper price to break upwards as well. But this is the stuff I’m looking at. It’s a positive price action. I’ll tell you what, it looks better than a lot of the tech stocks. So, it always shows there’s opportunities out there, just in the right parts of the market and the right sectors. And there’s almost always something which is interesting even when things are gloomy elsewhere. So, keep an eye on copper. There’s an ASX-listed version of this. It’s WIRE, W-I-R-E. And check it out and get the details on it, but I think it’s pretty much an overlay of the Global X Copper Miners ETF which is listed in the U.S. So, have a look at that if you’re interested in copper.
Now, I just got one interesting graph I want to show you. Turned up on my Twitter feed. And this is really interesting. It looks like this guy… So, Mark is a great trader. I love following some of his stuff. And it looks like this has been a photo taken off a screen. And I’m just going to blow this up. So, this is investment themes by decade and just takes on to what I was saying before is that there’s always something which is interesting. So, this goes back to the 1950s. So, I’ll just work through them. So, this is European stocks. In the 1950s, the boom area was European stocks. And look at this. This is a cumulative percentage return. So, European stocks in the ’50s, that was the place to be. Something like 600% return over the decade. Move into the ’60s, it was the nifty-50 and a class of U.S. industrial stocks which put on something like 400%. Move into the ’70s, which people think of the ’70s was a dead period for investment, but not if you are in emerging markets or commodities. They showed something like almost over 1000% return. Japanese stocks in the ’80s, tech stocks in the ’90s, emerging markets, commodities regained the play in the 2000s. The 2010s were about the American mega-cap, so that’s the FANG stocks, the Microsofts, Apples, Googles, that company. Big gains we’ve seen from them.
So, what are the 2020s going to bring? Are the 2020s going to be different? Are we going to have nothing exciting, or will there be something exciting and we need to find it? I think it’s the latter. I think there’ll be something exciting. We need to find it. I think the best way to find it is through momentum. We study the momentum, we look at the emerging opportunities, and that’s how we find the superstar areas of the decade.
So, interesting times ahead. It’s been a big year in the markets 2022. Let’s leave it there for this year. Let’s rule off. I’ll be back next year. Thank you for joining me. I’m going to move to one video a week for the next two weeks, so I won’t have a specific ASX 200 video. But it’s been fantastic having you as a viewer of the channel. Thank you for the support.
Please see video for more details analysis and charts
Looking for the best ASX stocks to buy now?
Motion Trader‘s algorithms scan more than 2,000 ASX stocks daily in search of medium term investment trends. We then tell our members precisely when to buy shares. And most importantly, we tell them when to sell.
Try a no obligation FREE 14-day trial of Motion Trader, and see what an algorithmic trading approach could do for you.
Meet Jason

I'm Jason McIntosh, the creator of Motion Trader. My career began in 1991 on the trading floor at Bankers Trust. Nowadays, I trade my own systems from home in Sydney.
Motion Trader is for investors who value robust analysis, data driven entry and exit signals, commentary, and education. I use engineered algorithms to identify when to buy and sell ASX stocks. No biases or guesswork, just data driven signals.