ASX 200s Potential Launching Pad | Episode 109
Where is the Stock Market Heading?
00:00 Intro
00:30 This is a key moment for ASX 200 (watch for this scenario)
03:57 The broker research that ended in disaster
07:33 Gold and FOMO strike again (what next)
12:00 Watch this level in copper
12:43 Look what this uranium stock is doing (this is how to play it)
Transcript
Please note: Charts available from video
This video is going to focus on the ASX 200. I’m also going to have a look at the latest developments in gold, copper, and uranium, so make sure you stick around for that. I’m going to leave a link for the video on the S&P 500 in the description section below. As always, this is general commentary and doesn’t take your personal situation into account. With all of that said, let’s get into our first chart.
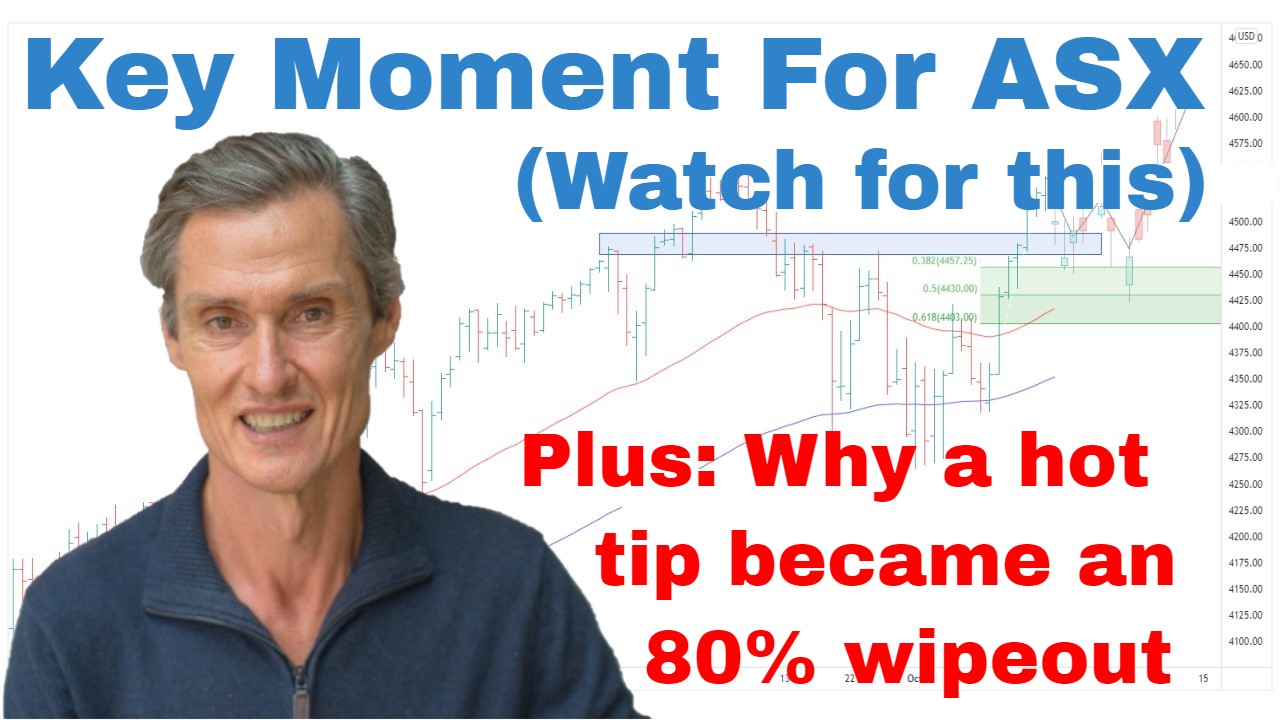
So, we’ve got the ASX 200 up on the screen. And really there have not been any great surprises this week. We’ve been talking about the potential for a pullback over the last several weeks now really, and we’re seeing that continue to unfold. And what we’ve seen this week is that the pullback has now made its way back to the top of this Fibonacci support region.
So, to get this Fibonacci region, I’m using the low point from January, the most recent high. And so far, we have come back to the 38.1% region, which is the top of that Fibonacci zone. This is quite a common area for markets to pull back. It’s not some sort of a mystical level that they always come back to, but it does work as a general guide. It gives proportion for a pullback. You get an advance, and then you get a pullback of a certain proportion, which fits into this Fibonacci band.
Also happens to coincide with where the 50-day moving average is currently coming in. So, we’re so far been getting a little bit of support around the 50-day moving average. Whether that continues, and we get a rebound, and then another retest. I don’t know. We’ve got to see how this continues to play out. But the pullback we’re getting, it’s just so typical when you get a market which runs so fast, gets stretched above the moving averages. You often get that pullback towards the moving averages. And that’s very much what we’re seeing at the moment.
I think the key now is, are we going to see buy the dip happen. Now we’re back at these moving averages. Now we’re back towards this Fibonacci region. Is there going to be accumulation? Are we going to see stocks starting to get accumulated on this pullback? That’s what you want to see in a healthy market. You want to see these dips being supported rather than what we were seeing last year with the rallies being sold. But so far, the dynamic we’re seeing since the October low is quite different to what we were seeing during much of 2022. Ideally, we start to see prices stabilize around these areas, but this could be a case where the market does stop and chop around for several weeks, could be several months.
A good scenario would be for some sort of a base to form around this region, and then that could create the launching pad for a retest of these highs, this triple top resistance around 7600. But we need to see how this price action unfolds. We don’t know at the moment. At the moment, I think we want to play this as if it’s a pullback, and that it does provide some sort of a springboard to higher levels in the months ahead.
But as I keep saying, this is about using risk management. I don’t think there’s a hurry to do anything at the moment, but I think we need to just wait for those right opportunities, right, for the opportunities that stack up, which may have good setups, good risk-reward parameters, and also getting out of the stocks which aren’t working. That’s where our risk management comes in, protecting that capital when it’s working, right setups, and the right timing to add stocks to your portfolio.
Now, I want to give you an example of why risk management is so important. And this came about… I got an email from a member of my Motion Trader service through the week. It was a really interesting one. And it’s an experience, which I hear so often from so many people. Now, this is a company called PointsBet Holdings. And it’s an online betting company. And so, what this member, Tommy, said, he’s reading some broker research in late 2021. So, this is where I’ve got the red circle. And the research was suggesting it was a really good buy. The research said, “This stock is undervalued. We think it’s going up to around $14.”
Now there’s a few points to make here. Firstly, look at its position relative to the moving averages. We have a situation where the moving averages were in decline. So, this is how it was when my subscriber was looking at the broker research. Had a situation where we had a small rebound off the bottom, but the 50 and the 100-day moving averages were clearly in decline, and the price was below those moving averages. So, if you’ve been watching these videos for a while, you’ll know that I always say that the bad stuff tends to happen when a market or a stock is below its moving averages. And sure enough, in the case of PointsBet, yeah, plenty of bad stuff happened.
So, point one, really think long and hard about, do you want to buy a stock that’s below its moving averages? Now, point two is about risk management. This is what I was just talking about, having an exit strategy when things don’t work. If something is not working, I think the best play is you accept that it’s not working relatively early, and you cut the position. Unfortunately, for my member, he said that that’s not what he did. He said he clutched his holding with an iron grip. And it’s not a pretty story. It’s down about 80% since that time. It’s such a common experience. So many people experience this, but it’s just so avoidable. Persistence is such a great thing in everyday life, but with an individual stock, persistence can be absolute unmitigated disaster. Exit points, I think they’re just so important because this was such an avoidable situation.
If you’re having trouble with this thing, come over to my website, come over to Motion Trader, take my free trial, go through the videos that I’ve prepared, see what I’m doing with calculated exit levels, and I can help people who have this trouble buying at the wrong time, and then holding on. It’s what I do. Come and check it out if that’s something where you struggle with.
And now, if you’re getting some value from this, please hit that like button. Please leave a short comment, just “Hey, thanks for the video.” It helps heaps. It tells YouTube people are engaging. YouTube then shows more people. Also, hit the subscribe button if you haven’t already, and as I was saying, come visit me over at Motion Trader, and see if what I’m doing could help you avoid stuff like that, and get into stuff which goes up, what I try to help people with.
Now, let’s have a quick recap of what’s going on with commodities this week. Let’s start with gold. Really interesting stuff. When we look at this rally that persisted through December into January, how many people through mid to late January were experiencing fear of missing out and clamoring in the gold stocks as they headed towards a high point before consolidation? It happens so many times. And you can never pinpoint these corrections. I was for a few weeks. For a few weeks, I was saying, “I think this is getting stretched,” and it kept grinding higher. But as so often happens, once a market gets stretched above these moving averages, it does pull back, and it can be hard watching it rise and not be on board. But it just goes to show there’s a time for buying, buying when things are breaking out, buying when things are pulling back to their moving averages, and then starting to lift off again, and then there’s a time for holding and being patient with adding to new positions.
And that’s been the case in gold, and that’s why I was suggesting for several weeks just be careful, be cautious with adding to gold stocks as a rally becomes extended because invariably, there is some pullback towards those averages. And that’s what we’re seeing at the moment. I think this is going to take more time to play out. Twenty percent rally in three months is a big move. And I don’t think there’s a hurry to do much in the gold market at this point. I think we’re going to see more consolidation. I don’t think it’s going to be a case for a quick return to the new highs. And I’ll show you what I mean. I want to have a look at a weekly chart of gold.
So, just jumping over to weekly. So, here’s where we currently are. We can see this rally since January. I want to focus in on this area here, this area from back in 2016 where we had a strong rally off the lows. And then you can see this resistance band, you can see this blue area above the price action where gold got to a couple of times. Really had three tests of this area, pulled back, and then… So, this lasted for quite a while at this range, not dissimilar to what we’re seeing more recently, and then we had a run back up towards the resistance. And the thing is when a market approaches a big resistance area, it often doesn’t just go straight through it. Often approaches it, has some sort of a consolidation and a pause. In this case, gold rallied up, pulled back towards the moving averages, consolidated, and then had a run at the resistance. This doesn’t look like much of a big deal when you’re looking at it on a weekly chart, but that’s actually five months’ worth of consolidation.
Now, if you go back to where we are now and think about how this could play out, these things never play out the same way. But nonetheless, the price action from 2016 to 2019, it is a typical type of setup that you often see on charts. If something like that were to happen, it’s quite feasible that gold does track sideways for several months for having a run at that resistance at some point in the months ahead. If it were to look something like that, that could be late ’23 into 2024 before there was a possibility of a breakout. So, no predictions there by any stretch, but just to make the point that a consolidation in gold that lasts several months is entirely possible. I don’t think we should be expecting a quick return to new highs. Maybe it happens. That’s why I say hold stocks, which is why I suggest holding stocks in the portfolio in profit where the trend has been up, but also be prepared for consolidation to play out. And then that provides the opportunity to accumulate more stocks, to get into stocks which maybe aren’t in the portfolio. Maybe the fun is over for the time being after that big three-month rally.
Now, just quickly jumping to copper. Not a great deal to report. I’m just going to go back to the daily chart on copper. We’re seeing that pullback back towards the support at around $4, back to the 50-day moving averages. Getting a little bit of a rebound there. I think copper remains… The overall structure of this chart remains constructive. It looks good. It’s just a case of, do we need to see more consolidation sideways? Maybe a bit more of a test low before we can get another possible upward leg. So, not in a super hurry to do much with copper, but overall, I think the structure looks good.
And just finishing up with uranium. Again, there’s not a lot to report in that the price still does remain above these moving averages, so I like the overall tone to this market. I want to play this from the upside. There is some resistance around current levels. So, we can just draw something here on the chart. So, around about this on this uranium ETF, the resistance is coming in around $17.50. And you can see we had a test in here in 2021, some work through this period in ’22. Again, some highs again last year. We’re testing into that region now. Could get some resistance there.
Interesting when I come over and we look at a stock like Cameco, being a big listed uranium producer in Canada. And this is looking at the New York Stock Exchange listing of Cameco. Big triangle trading range which has been in since April 2022, getting up towards the upper resistance band. What could happen? We’re also a bit stretched above these moving averages. Maybe it’s a case also with uranium getting up towards that resistance. Maybe we do get some pullback or a pause or a consolidation. Lets the moving averages catch up before we get a run at trying to break above out of this consolidation. I think the break out of this consolidation is going to be to the upside. Of course, I could be wrong, but we always use risk management. I think that’s where we’re heading. I’m not quite sure we’re there yet with where we are above the moving averages. Maybe we’ve got to get that pause or that consolidation. Let things catch up, and then have a crack at that resistance in the months ahead. But I think the overall uranium structure is shaping up. I think that’s going to be one of the really nice opportunities that comes potentially later in this year.
So, let’s leave it there for this week. Thank you for joining me. Hopefully, that’s been interesting. Lots of stuff to talk about. And forward to coming back, and talking to you next week. Until then, bye for now.
Please see video for more detailed analysis and charts
Looking for the best ASX stocks to buy now?
Motion Trader‘s algorithms scan more than 2,000 ASX stocks daily in search of medium term investment trends. We then tell our members precisely when to buy shares. And most importantly, we tell them when to sell.
Meet Jason

I'm Jason McIntosh, the creator of Motion Trader. My career began in 1991 on the trading floor at Bankers Trust. Nowadays, I trade my own systems from home in Sydney.
Motion Trader is for investors who value robust analysis, data driven entry and exit signals, commentary, and education. I use engineered algorithms to identify when to buy and sell ASX stocks. No biases or guesswork, just data driven signals.