ASX 200 Rallies Off Low | Is It Time To Buy? | Episode 120
Where is the Stock Market Heading?
00:00 Intro
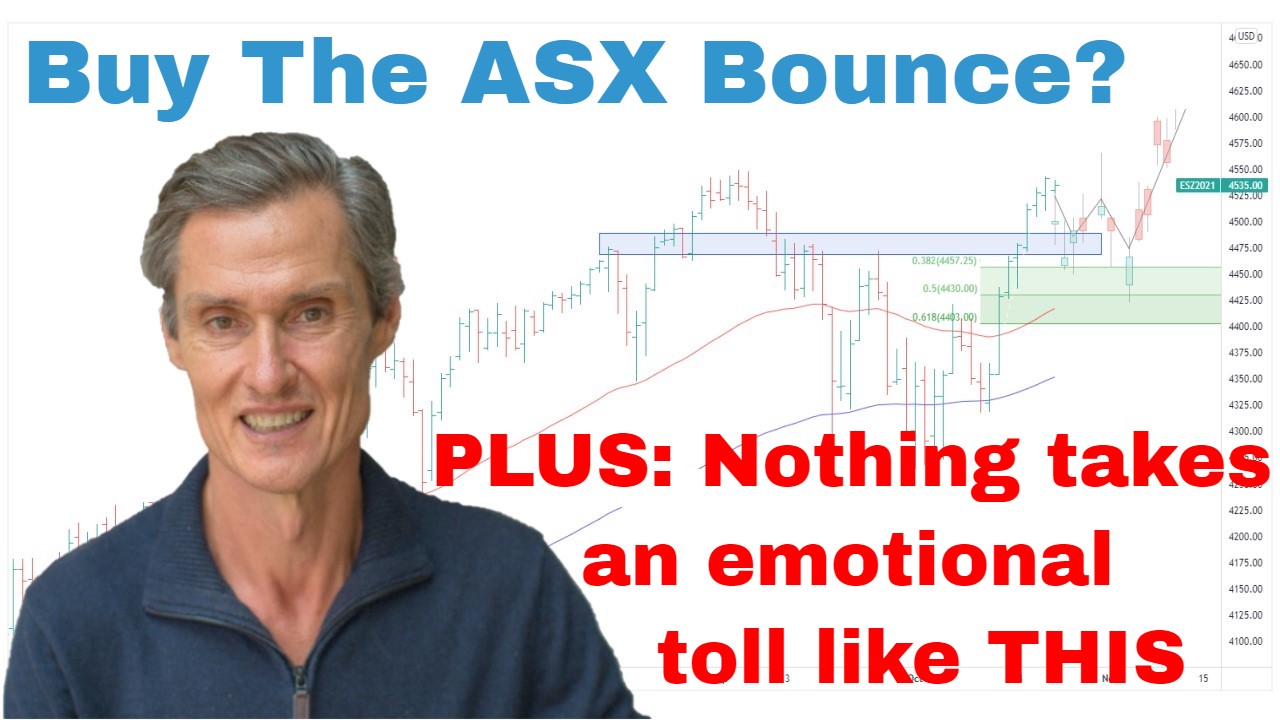
00:30 ASX 200 bounces (but what next?)
03:12 This wears people down more than anything
04:50 Don’t pre-empt this set-up in small caps – react to it.
07:40 Should you add to gold positions?
10:00 Uranium be coiling up for the next move
Transcript
Please note: Charts available from video
This video is going to focus on the ASX 200. I’m also going to have a look at gold and uranium, so make sure you stick around for that. I’ll cover the S&P 500 in a separate video (click here to watch). As always, this is general commentary. It doesn’t take your personal situation into account. With all of that said, let’s get into our first chart.
So, we have the ASX 200 up on the screen. And last week, I was talking about the possibility of a bounce. And we’ve certainly had that over the last few days. And there was no magic at all on that suggestion that maybe the market was setting up for a bounce. We had a situation where the ASX 200 seemed to be stretched below the moving averages, so I’m using the 50 and the 100-day moving averages, and it was also sitting at the Fibonacci retracement region. So, I’m using the low from September, October, using the February high. And this gives a Fibonacci region in this blue-shaded area. So, this is a very natural point for the market to have a rebound. And that’s what it’s done.
And with this rebound, with this establishment of at least a temporary low in around the 3800 mark, we can actually put some more…another support level, a new support level which we can monitor going forward. Comes in at around about that 6800 level. So, just looking at it going back to January last year you can see there are several touchpoints, a bit of work done on a number of occasions. So, that’s going to be a useful level to watch as we move forward.
I think the big question now is, where does this market go, now we’ve had the rebound? And I like the strength. I like the strength that we’ve seen in this rally. My concern last week was that maybe we’d get a choppy sideways rebound, moving averages would close into the downside, and then the market may have rolled over. We haven’t got that. Instead, we’ve got more of the V-shape recovery to this market. And that’s an encouraging sign. So, I think maybe we do get some sort of a pause. It has been a quick and robust rally. So, some pause would be quite normal.
And what I’d like to be doing, I’d like to be giving this, and this is what I am doing, I’m giving this rally from the September low the benefit of the doubt. That’s what I’ve been talking about in the S&P 500. That’s been the play over the last several months has been to see where this momentum takes us, give it the benefit of the doubt. It’s a difficult momentum play because of the ranging nature of the price action, but we do still have on balance, we’ve got broad upward momentum. So, it’s continuing to give that the benefit. But I want to stay conservative. As I’ve been saying, this is a range-bound market, and ranges are just such a battlefield and they take a toll financially. They take a toll emotionally. I think the hardest part of playing these big ranges… This is 19 months the ASX 200 has essentially gone nowhere.
And what makes a range so hard is that you end up with your profits are typically small. The losses are more frequent. Even if you keep them small, your profits probably aren’t paying for the more numerous losses because the profits are small, the trends are infrequent, and they grind on and they just wear people down emotionally. You see your account going backwards. And it’s a difficult time. So, my way of playing the range, it’s you reduce risk, you pull your risk back. You hold your stocks which are on uptrends, but then you get rid of those ones which are struggling. That’s very much what I’ve been doing. Risk management is always important, but it’s especially so in these times when we don’t have the dominant trend and we’re trying to see where the next big breakout is going to come from. ASX 200 is being capped at this 7700 barrier for, as I was saying before, 19 months. That’s a long time to be in a range and grinding sideways. This period will end. We will get another big trend, but we need to wait it out.
The small ordinaries, just having a quick look at that. And similar situation in that we’ve had a strong bounce, and that is good. It’s good to get that strong bounce. And it’s back through this support resistance area. Didn’t really offer much support and resistance over the last month. So, I’m just going to take that off the chart. I don’t know that that’s the most helpful of levels just for this point in time. And what I’m going to do instead, I’m going to draw a range on. So, we can join these two top points. And on the low side… We could do the downward-slopping parallel lines like I’ve done on the S&P 500. But on this, I’m going to use a flat bottom. I’m going to just run that across like that at around 2600, pick up this low in October, joining that up with the low from June, and we get a trading range. Gives us a nice clear look at where we currently are.
The thing with trading ranges is this. They take a while before you can actually get a good visual on what the range actually is. We needed to wait for this point in January, only a couple of months ago, and then give it time to move away before we could actually start to firm up a range. And makes it difficult to trade. But we’ve got this range now, so we have something to base off moving forward. And the question for me is, is this going to ultimately be a big base that we break up from, or there’s also still the possibility that this breaks to the downside? So, you never know which way a range is going to go. It’s important not to have a fixed idea in your head about what has to happen because nothing has to happen. Be flexible with the price action, and we go with whatever way the market breaks. That’s the way I’d always suggest playing a range. Don’t preempt it, react to it. And for me, it’s very much, at the moment, operating on a stock-by-stock basis, looking for stocks with the right setup, stocks that are breaking upwards but also being aware that a lot of breakouts fail when we’re in this range trading period.
Now we’ll jump over and have a look at a few of the commodities, but first of all, if you’re getting some value, please hit that like button, leave a short comment. It just tells YouTube you’re engaging, you’re watching. YouTube does its thing and shows other people, which is what it’s all about for me. And also hit that subscribe button. Come visit me at Motion Trader. If you want to get an email notification every time I send these videos out, just register with Motion Trader and I’ll do that. You’ll get an email from me each Saturday morning.
Now, okay, let’s jump over to gold. So, interesting week for gold. It’s holding its ground. It’s holding at these higher levels. It looks like it wants to break to a new high. Let’s just put some moving averages on, put the 50 and the 100-day moving averages on. And when we look at the moving averages, it is getting stretched. It’s stretched above those moving averages, which is something I get concerned about. I don’t like adding to positions when they’re stretched above moving averages. A little bit like the situation we had in January. It stayed elevated for several weeks, but when it did correct, it corrected quite quickly and quite heavily.
We can also just compress this chart a little bit, and you can see we’ve got the heavy overhead resistance, double top resistance at around 2080. So, with the market being close to 2000 now, it’s really getting within close proximity of heavy overhead resistance. So, from that perspective, it’s not really an asymmetric entry point from the way I look at markets. I like to look at a market… It’d be better to buy… I prefer to buy earlier. And when we get these moving averages crossing earlier in the cycle, in the setup, and then letting positions run rather than buying just beneath overhead resistance. I think that’s where you can run into trouble and end up in a position you wish you’d maybe been a little bit more patient with.
A good example of that is just going back to the ASX 200. I spoke about this quite a bit during late January. That wasn’t an asymmetric entry point. We’re getting to overhead resistance, and as it turns out, we got a bit of a pullback. And that’s the thing to be careful with gold now. Will there be another pullback close to this big overhead resistance point? So, I like it. I think I’m running with my gold positions. I’m letting them run, but I’d be very selective with the individual stock setups. There could still be some good stock setups, but yeah, it’s something to be aware of, that gold is near an overhead resistance point.
Over to uranium. And interesting week. We’re starting to get a bit of a bounce off this low point we had in mid-March. It’s an encouraging bounce. We are still below these moving averages. So, it’s certainly not a case to say, “Okay, let’s start loading up in uranium. Now, this could also go a couple of ways. It could also still just be a zigzag correction, and there could be another move to the downside. So, that’s something to be aware of. The more positive scenario is that uranium is starting the coil into a range which would potentially then be a launching pad for a breakout. So, if that were to happen, we can draw the upper boundary with a bit of confidence at the moment. The lower boundary, it’s too early to draw this in and have much confidence because this is only a couple of weeks off the low. I’d like to see it before I put that lower level in. I’d like to see it move a little bit more within the range. Then if it coils some more, then it opens a possibility of that breakout.
So, this isn’t a prediction by any stretch, but it’s something to keep an eye on. This is a possibility that we’re looking for which could give us a good lead into some of those uranium stocks. We don’t know. That may not happen. This may still pull back lower and we may still be trapped in this range for quite a bit longer. We just need to wait and see. The unfun thing about range is they can drag on. So, I’d love to tell you that the stock markets are all set up ready to go, but I think at the moment, it’s a situation of we want to keep our powder fairly dry and just play defensively, conservatively long positioning is how I’m approaching it, and then we respond to the price action as it continues to unfold.
So, hopefully, that’s been interesting. Hopefully, it gives you a few ideas. Thank you for joining me as always, and I look forward to coming back and talking to you next week. Until then, bye for now.
Please see video for more detailed analysis and charts
Looking for the best ASX stocks to buy now?
Motion Trader‘s algorithms scan more than 2,000 ASX stocks daily in search of medium term investment trends. We then tell our members precisely when to buy shares. And most importantly, we tell them when to sell.
Try a no obligation FREE 14-day trial of Motion Trader, and see what an algorithmic trading approach could do for you.
Meet Jason

I'm Jason McIntosh, the creator of Motion Trader. My career began in 1991 on the trading floor at Bankers Trust. Nowadays, I trade my own systems from home in Sydney.
Motion Trader is for investors who value robust analysis, data driven entry and exit signals, commentary, and education. I use engineered algorithms to identify when to buy and sell ASX stocks. No biases or guesswork, just data driven signals.