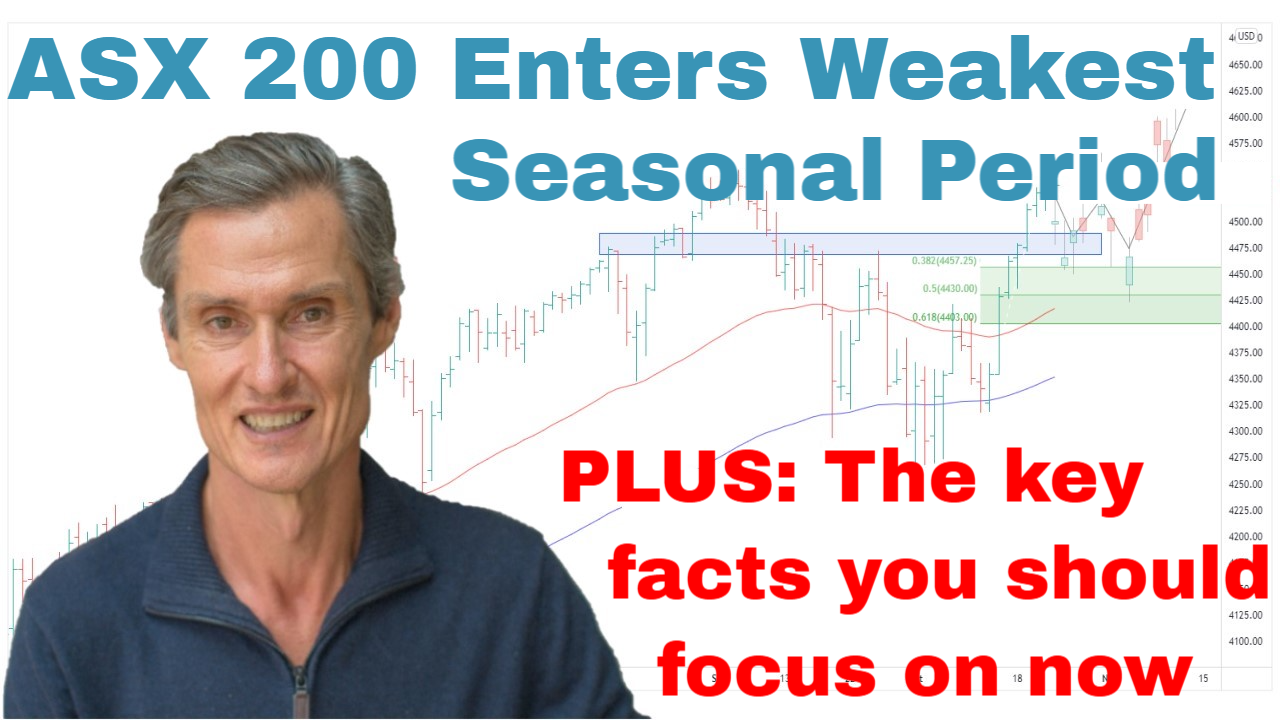
ASX 200 Enters Weakest Seasonal Period – Should You Sell? | Episode 291

By Jason McIntosh | 1 August 2025
ASX 200: Key Support Holds After 22% Rally
The ASX 200 has entered its second week of consolidation after a sharp 22% rise from the April low. The market is digesting gains, but the structure remains bullish—so far.
Key Levels to Watch:
- Support around 8,630 – aligns with the February high, June peak, and July breakout.
- Recent low on 25 July – a break below here could signal a deeper pullback.
A pullback isn’t necessarily bearish. It could simply reflect the market needing a breather after its rapid rise. With August and September historically weaker months, a pause wouldn’t be surprising.
“Healthy trends often include periods of consolidation.”
If prices break lower, the next supports are the 50-day and 100-day moving averages.
ASX 200 Equal Weight Index: Shallow Pullback from All-Time High
The Equal Weight ASX 200 continues to show strength, holding most gains after a new all-time high in July.
What This Suggests:
- Shallow pullbacks can indicate underlying buying pressure.
- Both the 50-day and 100-day moving averages are rising.
- The structure supports a broad-based rally—a positive signal for trend traders.
This strength is mirrored in the Small Ords index, suggesting support across market segments.
“Broad-based rallies are a hallmark of sustainable bull markets.”
S&P 500: Trend Intact Despite Intraday Reversal
The S&P 500 notched another all-time high last week before reversing 1.5% lower in a single session. While such intraday declines grab headlines, they don’t necessarily break the trend.
Key Points:
- Market remains above rising 50- and 100-day moving averages.
- A series of higher lows continues to build the uptrend.
- One-day reversals aren’t enough to shift the outlook.
“One bar doesn’t make a trend.”
This same pattern—a sharp intraday reversal—occurred earlier in the year and last May. In both cases, the market resumed its upward trajectory.
Equal Weight S&P 500: Lagging, But Still Constructive
Unlike the ASX, the Equal Weight S&P 500 is underperforming the headline index. The big caps—like Nvidia and Meta—are doing the heavy lifting.
Yet:
- The equal weight index is still near recovery highs.
- The structure of rising lows remains in place.
This divergence is worth watching, but doesn’t invalidate the broader trend.
“Rising lows are the building blocks of uptrends.”
Market Breadth: Percentage of Stocks Above 100-Day Average
An indicator tracking the percentage of S&P 500 stocks above their 100-day moving average provides further context:
- Currently at 62%, down from a recent high of 76%.
- Still well above the 50% midpoint, indicating solid breadth.
- Historical patterns suggest this metric often rises toward 85–90% before peaks occur.
So, while there’s room for further upside, some consolidation would be normal.
Final Thoughts: Structure Over Headlines
Despite headlines and intraday volatility, the broader structure of both the ASX 200 and S&P 500 remains bullish.
- Stay long quality stocks in uptrends.
- Use trailing stops to manage downside risk.
- Let the market structure—not noise—guide your actions.
“The play here is staying long stocks—not looking for reasons to sell.”
This is classic trend following: hold positions while the trend is up, and only exit when the structure says so.
👉 For a deeper dive into technical analysis, check out our Weekly Strategy Sessions.
Motion Trader‘s algorithms scan more than 2,000 ASX stocks daily in search of medium term investment trends. We then tell our members precisely when to buy shares. And most importantly, we tell them when to sell.
Try a no obligation FREE 14-day trial of Motion Trader, and see what an algorithmic trading approach could do for you.
Take a Free 2 week Motion Trader trial
Video Timestamps
00:00 Intro
00:40 ASX 200: Is the market pausing or stalling? (Watch this level closely)
03:00 What could happen if the 25 July low breaks
04:50 We’re entering the seasonally weakest period (what it means now)
05:40 Don’t overlook this clue from the Equal Weight index
09:00 SP500’s sharp reversal (a warning of what’s coming?)
10:05 These are the key facts to focus on now
12:50 The broader market is lagging (is it a sign of trouble?)
14:40 Key indicator could be pointing to THIS
🎯 Exclusive Strategy Session Member Content:
[18:10] US small caps stall at key resistance (what’s next?)
[20:20] Small Ords at a critical point – why the next few days matter
[23:40] Emerging Companies haven’t done a good job of this
[24:55] Is gold at risk of breaking down? (What I’m doing with my gold stocks)
[37:40] This could be gold’s biggest near-term risk
[41:35] Copper has one of it’s biggest falls ever (here’s how to play it)
[45:20] Oil building a base – but is it too early to buy?
[47:40] Uranium holding but stocks selling off (what to do now)
[53:00] Q&A with lots of stock ideas: BMN, BCI, 360, NWL, TPW, BTI, WBT, DRO, SVR, MMS, CNI, CPU, CNB, ESTX, USL, FMG, RIO, BHP, MIN, CGNX, A1M, UUUU

Jason McIntosh | Founder, Motion Trader
Jason’s professional trading career began over 3 decades ago. He’s a founder of two stock advisory firms, a listed funds management business, and has helped thousands of investors navigate the stock market. Click here to read Jason’s incredible story of, at age 20, sitting alongside some of the world’s greatest traders (and the life changing experience that came with that).

