ASX 200 Defies Bad News | Episode 82
Where is the Stock Market Going?
00:00 Intro
00:30 This is what I like about the ASX200’s price action
03:23 Individual stocks with positive price action
06:06 Also look for set-ups like this
08:01 Don’t just watch the ASX 200 (do this as well)
09:08 This is how I’m navigating the current market
Transcript
Please note: Charts available from video
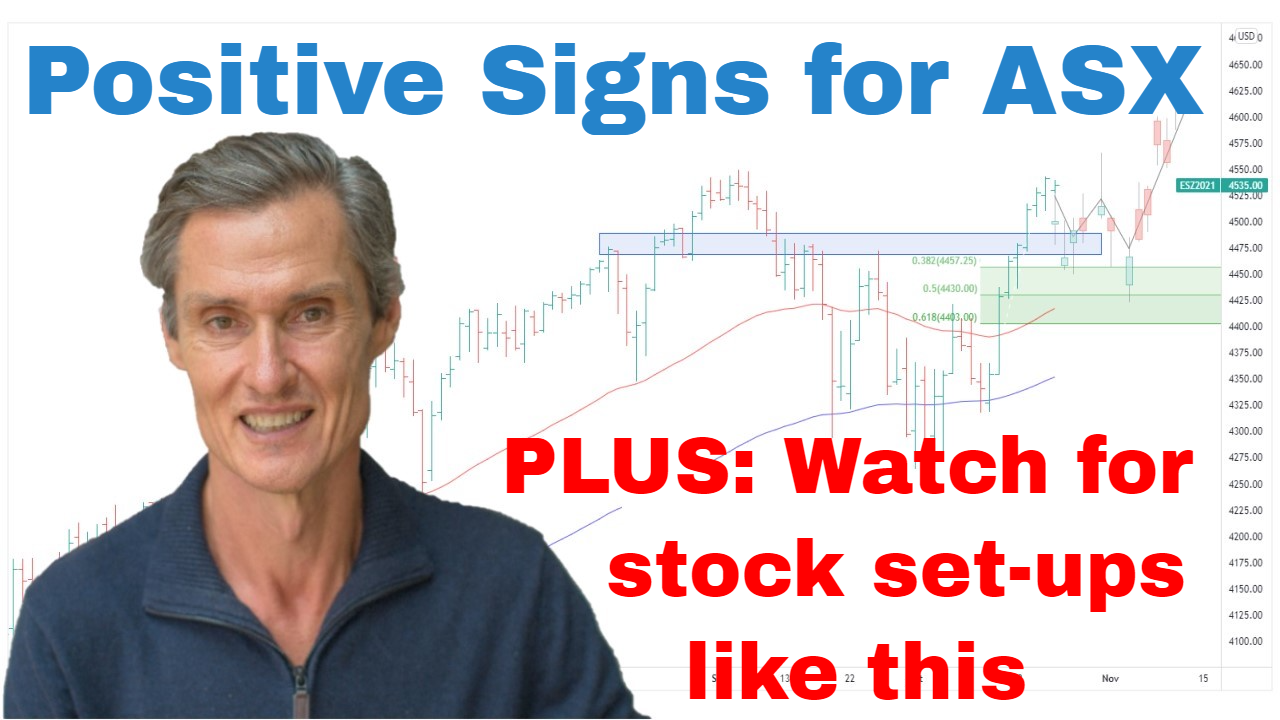
So, we’ve got the ASX 200 up on the screen. And it’s been an interesting week. We’ve seen quite a bit of movement in the index. It’s moved within a 3.5% range, which is quite a bit…It’s quite a relatively wide range for a week. But what’s interesting is that we’re now closing the week only slightly higher than we closed this time last week. So, quite a bit of activity for not a lot of overall movement. But the price action, I’d say that the overall price action is mildly positive. We’ve got the ASX 200 now above its 50-day moving average. It was briefly above the 100-day moving average. Hasn’t been able to close above there as yet for the week, but we are closing the week above the 50-day moving average. So, what happens here, it doesn’t change the trend but it starts to create more constructive price action.
And as I often say, the most vulnerable part for a market, the most vulnerable time for a market is when it’s below the moving averages. This is when the bad stuff happens. The bad stuff happens when a market is below the moving averages. So, this is mildly positive that we’re now seeing the market get back above the 50-day. We still need to see these moving averages turn higher. We need to see them cross. We need to see the 50-day moving average above the 100-day moving average, and that’s going to take time. That won’t happen next week. But the groundwork is being done and it’s mildly positive.
And the other thing to note which is positive this week is that the local stocks, the ASX 200, it’s holding its ground better in the face of bad news. So, we’ve had volatility in the U.S. We’ve had a local rate hike, but the market now seems to be absorbing this bad news better. It wasn’t long ago where bad news would see the market go into a tailspin. And that’s not what it did this week. Did have a sell-off from the highs, but we are still above where we were this time last week. So, it’s too early to say where we are heading to from here. This could all be part of a large basing pattern which is still playing out, but as I say, it’s too early to say. So much could still happen. This could still be a pause before lower levels, just as it could be a base that sees the market turn higher. So, we really need to keep watching this price action for guidance as to what could be coming next. It’s not a clear-cut picture. We’re not in an established trend which is more straightforward to analyze. This is a tricky part of the cycle. This is where it gets tough. So, we’ve got to watch this price action carefully.
And what has been interesting, though, is that I’m seeing more buy signals for stocks that have been sold off significantly over, say, the last 9 to 10 months but have formed bases and are now turning higher. So, what I’m doing each day, I’m doing algorithmic scans of the market and I’m looking for stocks that are exhibiting signs of upward momentum where they’re above their moving averages. I’ve just got a couple of examples to go through with you. So, one is this stock here, Praemium Limited. Now, I spoke about this last week. And what’s been interesting this week is that we’ve seen follow-through on the upside and the stock closing up at a new high, its highest level since back here around February, and that’s despite the volatility that we had seen in the market during the week.
And I want to talk more about…this is more about the setup than about the stock. So, the stock ticker code is PPS if you want to look at the setup. But it’s more about the setup that I’m looking for and the setups that I’m seeing generally at the moment. So, this is a rounding basing formation. It’s a setup which you often see in markets. So, rather than buy a stock when it’s in its decline phase when it’s below the moving averages, it’s a case of letting the decline play out. But then you see the stock, it loses momentum, so selling pressure starts to dry up, selling becomes exhausted, then the stock starts to become accumulated and it starts to round higher. It’s not just a case of finding a stock which has a rounding basing pattern because some stocks can still then trade sideways for months if not years. Wait for these moving averages to cross, wait for the 50-day to get above the 100-day, and then waiting for prices to break to a new high.
So, the moving average crossover is a great start, but I like added confirmation of a price breakout to a new high. And that’s what we saw happen with this stock towards the middle, the later part of October. We’re seeing some follow-through momentum develop now. And none of this guarantees that a stock’s going to continue higher by any stretch. Nothing guarantees that, but operating on this basis of moving averages and breakouts, it helps shift the odds in your favor that you end up with a stock that continues to trade higher and trend higher over potentially the months ahead. And then if you can do that consistently across your portfolio, it’s how you can build a portfolio with a strong stock bias.
So, I’ll show you another recent example. This one turned up in my signals two, three weeks ago, a company called Green Technology Metals, GT1. It’s a lithium-orientated play. So, again, we’ve got these moving averages. And this was a little bit different. This wasn’t a rounding base. This was more a V-type recovery. V-type recoveries are a little bit harder to catch. You got to chain a keen charter. You might also spot this hidden shoulders reversal pattern which appeared here. So, you got a shoulder, you got a head, you got a shoulder. And these are harder to catch because it involves buying stocks when they’re below their 50-day moving average, which is something I don’t tend not to do really do. You can use shorter-term moving averages to try and time these, but it’s a different strategy and they can be harder to catch. I’m looking for more the medium-term plays.
So, we’ve got the V-shape recovery, but then we’ve got the sideways price action which has allowed the moving averages to cross, and then again we’ve got the breakout where the prices moved to a new high point after the moving averages cross, which gives that price momentum confirmation. And you can see that the price has…since the signal which was here in mid to late October, the share price has continued to run, closing at a new high on Friday afternoon. So, these are setups which I think are interesting to keep a close eye on. And what has been interesting is that over the last several months, there haven’t been too many entry signals at all, but just in the last few weeks, I’m starting to see more setups like I’ve shown you in these last two examples. And they’re also appearing across a range of sectors like retail, automotive. I’ve seen them in technology, in mining. So, rather than just keeping an eye on the ASX 200 or the all ordinaries like big indices, I think it also pays to look for those individual stocks. Look at the setups you’re seeing in the individual stocks, and that can help gauge what the overall market might be doing. So, the underlying positive I think for the market from what I’m seeing individual stocks is I’m seeing a number of stocks form bases and turn higher. So, that could be a positive to the ASX 200 generally.
Now, if you’re getting some value from this video, please hit that like button. Please leave a short comment, just “Hey, thanks for the video.” It just tells YouTube that you’re watching, you’re engaging, and if people are doing that, YouTube shows more people. That’s how it works. And that helps a lot because it takes a piece of time to put it all together. So, if you can do that and people are watching, that’s why I’ll make the videos. If no one’s watching, not much worth making a video. So, please do that. It helps a lot. And also, come over and visit me at motiontrader.com.au and see the momentum work I’m doing and the work with exit strategies that might be able to help with what you are doing with your portfolio.
Now, just to wrap all this up, I think stock selection in this part of the cycle, it’s more important than ever. It always matters but especially so when the index isn’t trending. When the index is moving sideways like it is now, I think you’ve got to really have the ability to look at the setups and the individual stocks, look at the opportunities and try and engage what’s happening from that perspective. For me, it’s about looking for stocks which are trading above their moving averages. I don’t want to know about stocks when they’re below their moving averages. That’s where all the trouble tends to start. Not about trying to pick lows and falling stocks. It’s about getting on momentum as momentum is going up. I’m starting to see some interesting plays, but I think it’s still a case of stay cautious. Just stay cautious. This is not a bullish environment that we’re in at the moment. It’s an environment where the ASX has volatility to it. Global markets have volatility to it. So, you want to get into the stocks which are exhibiting the right type of chart structure, the right type of momentum. And be cautious, be defensive, but also don’t be afraid to look for those stocks with the right setups.
Please see video for more details analysis and charts
Looking for the best ASX stocks to buy now?
Motion Trader‘s algorithms scan more than 2,000 ASX stocks daily in search of medium term investment trends. We then tell our members precisely when to buy shares. And most importantly, we tell them when to sell.
Try a no obligation FREE 14-day trial of Motion Trader, and see what an algorithmic trading approach could do for you.
Meet Jason

I'm Jason McIntosh, the creator of Motion Trader. My career began in 1991 on the trading floor at Bankers Trust. Nowadays, I trade my own systems from home in Sydney.
Motion Trader is for investors who value robust analysis, data driven entry and exit signals, commentary, and education. I use engineered algorithms to identify when to buy and sell ASX stocks. No biases or guesswork, just data driven signals.