ASX 200 Technical Analysis: Next Big Move After Pullback — Rare Signal Since 2021 (September 2025)
By Jason McIntosh | 19 September 2025
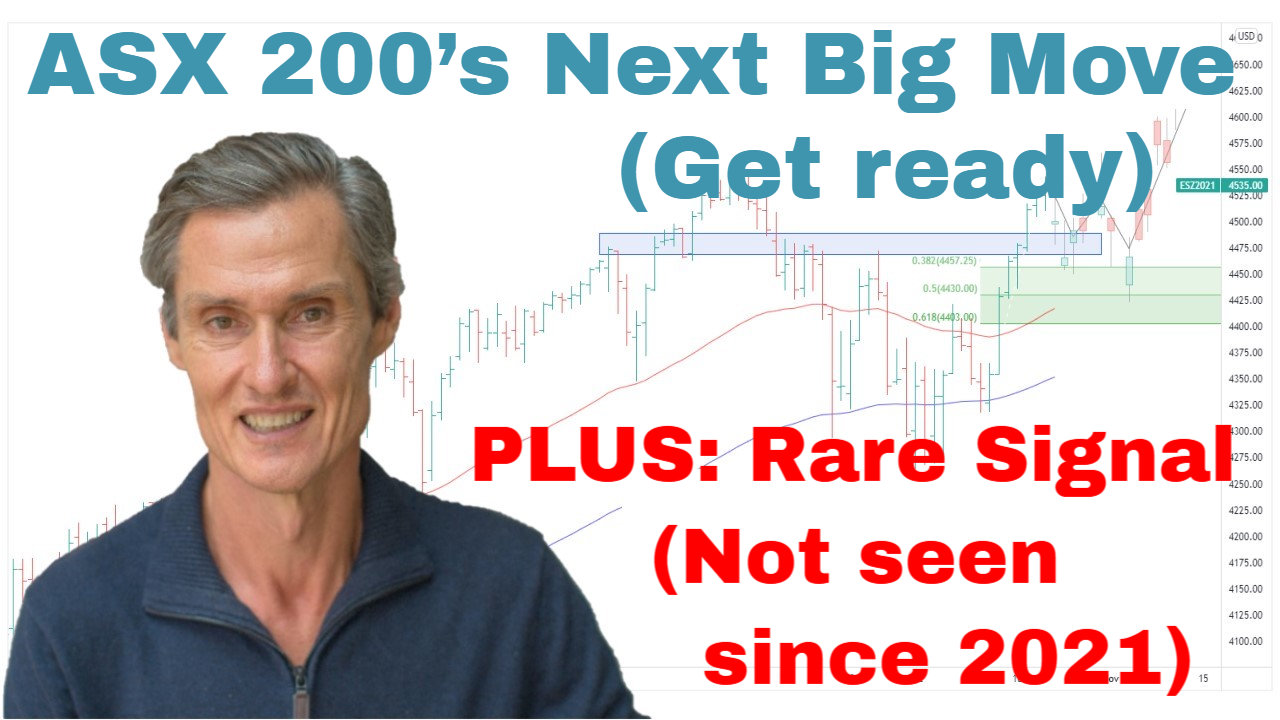
ASX 200 Technical Analysis: Next Big Move After Pullback
ASX 200 technical analysis this week shows the index finding support around the 50-day moving average after its largest decline since the April low. The big question: will this also become the longest consolidation of the advance — or is a new high next?
What the price action is saying
The index has slipped ~3.5% from its peak, then stabilised at the 50-day MA while remaining above the 100-day MA.
That positioning typically reflects buy-the-dip behaviour rather than trend failure.
Momentum hasn’t kicked back in yet, so more sideways work is possible as the market “catches its breath” after a ~26% multi-month surge.
A rare weekly RSI signal (last seen in 2021)
On the weekly chart, RSI recently pushed above 70 and rolled over — a setup that doesn’t appear often. Historically, that move often reverts toward the 50 zone.
- In 2021 the same pattern preceded a longer, choppier consolidation.
- In 2013, it resolved as a pause within the uptrend before prices advanced again.
Current breadth and trend structure suggest the latter outcome is more likely, but the signal reinforces the case for patience while we base.
Equal Weight ASX 200: leadership from the broader market
The ASX 200 Equal Weight Index continues to outperform, making new all-time highs and holding above its 50-day MA while the headline index rests on it.
That relative strength shows the broader market is healthy, not just a handful of mega caps.
👉 Broad participation is often the foundation of strong uptrends.
How to position: Stay aligned with the trend, avoid chasing extended leaders, and use wide trailing stops to ride consolidations without getting shaken out.
S&P 500 Technical Analysis: Records with Under-the-Hood Strength
The S&P 500 notched another all-time high this week, with the Dow and Nasdaq confirming. Price remains above rising 50- and 100-day moving averages with a clear ladder of higher highs and higher lows.
Breadth check: why this matters
- ~61% of S&P 500 stocks sit above their 100-day MA — down from recent peaks but still constructive.
- The broader Russell 3000 shows ~70% above their 100-day MA, suggesting small and mid-caps are quietly leading.
Together with a recent rate cut near highs (a backdrop that has historically skewed positive over 12 months), this supports the idea of an ongoing uptrend — even if interim pullbacks occur.
👉 For context on how these patterns play out, see how to trade breakouts successfully.
Playbook
- Respect the trend.
- Manage risk with wide trailing stops.
- Resist the urge to pre-call a top. Trends often run longer than most expect; staying invested with a disciplined exit plan helps you participate while protecting capital.
Key Takeaways
- ASX 200: Biggest pullback since April, now finding support at the 50-day. The rare weekly RSI >70 then down implies more consolidation is possible, but trend remains up.
- Equal Weight ASX 200: New highs and outperformance indicate broad participation, a hallmark of healthy bull phases.
- S&P 500: Record highs with supportive breadth; small/mid-caps improving beneath the surface.
- Strategy: Stay long with wide trailing stops, buy strength from sound setups, and let the market confirm re-acceleration.
👉 For a deeper dive into technical analysis, check out our Weekly Strategy Sessions.
Motion Trader‘s algorithms scan more than 2,000 ASX stocks daily in search of medium term investment trends. We then tell our members precisely when to buy shares. And most importantly, we tell them when to sell.
Try a no obligation FREE 14-day trial of Motion Trader, and see what an algorithmic trading approach could do for you.
Take a Free 2 week Motion Trader trial
Video Timestamps
00:00 Intro
00:40 ASX 200 stabilises (but be ready for THIS)
03:40 Key indicator hasn’t done this since 2021
07:00 Why is the Equal Weight outperforming?
08:40 I’m doing this now
09:55 S&P 500 hits new high (but this is more impressive)
10:55 Don’t make this expensive mistake
12:25 Market internals reveal a surprising outcome
15:20 History says THIS will happen in 12 months

Jason McIntosh | Founder, Motion Trader
Jason’s professional trading career began over 3 decades ago. He’s a founder of two stock advisory firms, a listed funds management business, and has helped thousands of investors navigate the stock market. Click here to read Jason’s incredible story of, at age 20, sitting alongside some of the world’s greatest traders (and the life changing experience that came with that).
Meet Jason

I'm Jason McIntosh, the creator of Motion Trader. My career began in 1991 on the trading floor at Bankers Trust. Nowadays, I trade my own systems from home in Sydney.
Motion Trader is for investors who value robust analysis, data driven entry and exit signals, commentary, and education. I use engineered algorithms to identify when to buy and sell ASX stocks. No biases or guesswork, just data driven signals.