ASX 200 Technical Analysis: Stabilising After Biggest Pullback in 5 Months (September 2025)
By Jason McIntosh | 5 September 2025
ASX 200 Technical Analysis: Stabilising After a Sharp Pullback
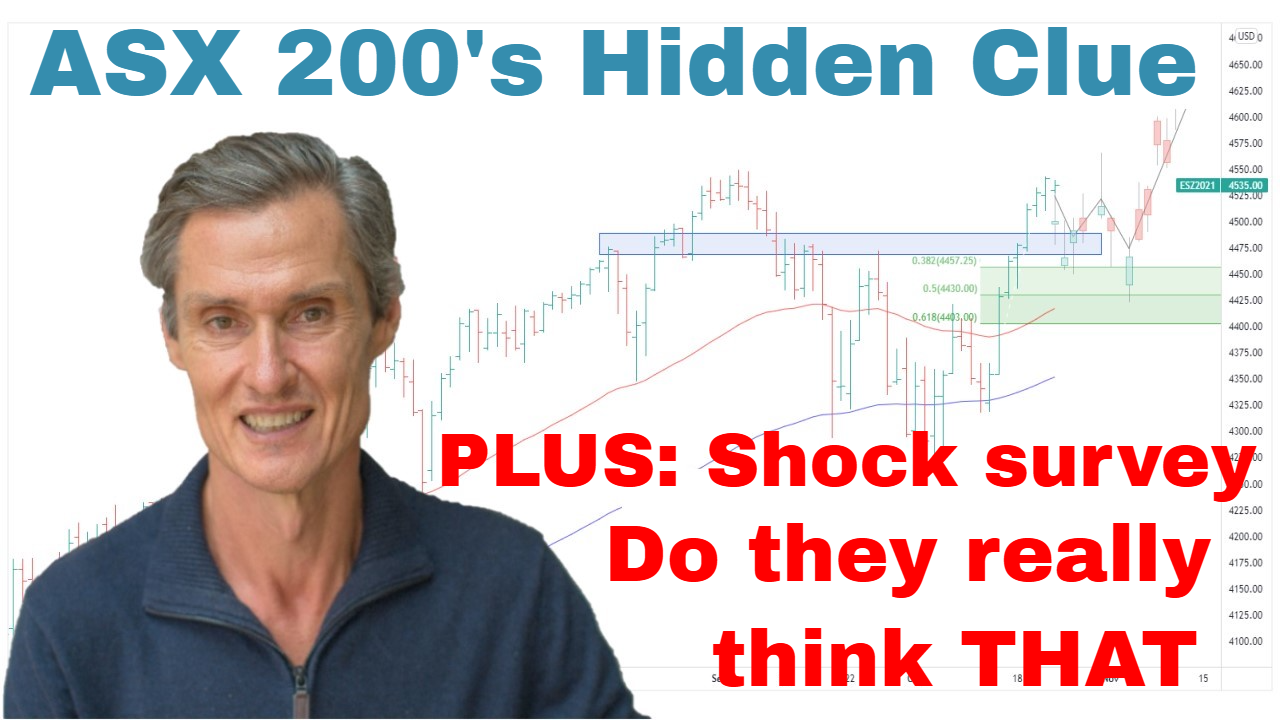
The ASX 200 technical analysis this week shows the index stabilising near its 50-day moving average after the sharpest pullback in five months. The big question: is this the end of the decline, or simply a pause before new all-time highs?
Over the past two weeks, the ASX 200 fell nearly 4% from record levels — its largest multi-day decline since April. Yet this week, price action has steadied around the September low, with buyers stepping in near key support.
Why This Pullback Matters
- Bull markets often progress in waves: rallies that push prices away from moving averages, followed by consolidations back to support.
- The ASX 200 has now returned to its 50-day moving average, echoing patterns from 2024’s bullish phase.
- Stabilising at rising averages is a classic sign of strength, not weakness.
For traders and investors, the lesson is clear: don’t confuse a healthy pullback with the start of a bear market.
Learn more about how moving averages and breakouts guide trading decisions
Equal Weight ASX 200: Hidden Strength
The Equal Weight Index adds another bullish clue. Unlike the headline ASX 200, which touched its 50-day average, the Equal Weight remains comfortably above it.
This relative strength tells us:
- Weakness has been concentrated in the large-caps.
- The broader market is holding up well.
- Shallow pullbacks across most stocks indicate sustained buying interest.
Historically, broad participation makes rallies more durable. It’s narrow leadership that often signals late-stage risk.
Strategy: How to Position Now
Many investors panic when headlines highlight “the biggest pullback in months.” But trend followers know the smarter play:
- Stay positioned with the trend as long as price remains above rising moving averages.
- Use wide trailing stops to ride out volatility and avoid being shaken out prematurely.
- Avoid chasing stocks stretched far above support — instead, wait for setups near consolidation zones.
Whether this pullback becomes a multi-week sideways chop or a quick “touch-and-go” bounce, the core strategy is unchanged: maximise time on trend, minimise emotional decision-making.
Discover how to stay with trends and manage exits effectively
S&P 500 Technical Analysis: All-Time Highs Keep Coming
Across the Pacific, the S&P 500 technical analysis shows a very different picture. The index hit its 22nd record high of 2025 last week, breaking out after three weeks of consolidation.
- The Dow and Nasdaq also posted new highs, supported by rising 50- and 100-day moving averages.
- The Equal Weight S&P 500 confirmed the move, showing broad participation beyond just mega-cap leaders.
Historical Perspective
Fresh research highlights that when the S&P 500 posts four consecutive monthly gains finishing at a record high, the next 12 months are higher 86% of the time (18 out of 21 cases since 1980). The average return: +14.2%.
While history doesn’t guarantee the future, it reinforces the lesson: strong performance isn’t automatically bearish.
Investor Sentiment: A Contrarian Signal
The latest AAII investor sentiment survey revealed something extraordinary:
- Nearly 50% of investors are bearish — even as the market sets new highs.
This is not how lasting tops usually form. Bull markets typically end amid widespread optimism, not widespread doubt. A crowded sideline of bears can act as fuel for further gains.
Key Takeaways
- ASX 200: Stabilising at the 50-day average after its biggest pullback in five months. Odds still favour higher levels into year-end.
- Equal Weight ASX 200: Shows relative strength, signalling broad participation.
- S&P 500: New all-time highs supported by breadth and historical momentum.
- Investor Sentiment: Skepticism remains high, which is often bullish fuel.
👉 For a deeper dive into technical analysis, check out our Weekly Strategy Sessions.
Motion Trader‘s algorithms scan more than 2,000 ASX stocks daily in search of medium term investment trends. We then tell our members precisely when to buy shares. And most importantly, we tell them when to sell.
Try a no obligation FREE 14-day trial of Motion Trader, and see what an algorithmic trading approach could do for you.
Take a Free 2 week Motion Trader trial
Video Timestamps
00:00 Intro
00:50 ASX 200 stabilises – but are new highs likely?
03:20 One of the biggest mistakes people are making
04:10 I’m positioning my portfolio like THIS
06:30 This is what the ASX 200 ISN’T telling you
10:25 S&P 500 hits new high (but look at the Dow)
12:40 Don’t overlook the signals from the Equal Weight
14:00 Must see research (it’s counter to what many believe)
16:30 You won’t believe this survey result – astonishing!

Jason McIntosh | Founder, Motion Trader
Jason’s professional trading career began over 3 decades ago. He’s a founder of two stock advisory firms, a listed funds management business, and has helped thousands of investors navigate the stock market. Click here to read Jason’s incredible story of, at age 20, sitting alongside some of the world’s greatest traders (and the life changing experience that came with that).
Meet Jason

I'm Jason McIntosh, the creator of Motion Trader. My career began in 1991 on the trading floor at Bankers Trust. Nowadays, I trade my own systems from home in Sydney.
Motion Trader is for investors who value robust analysis, data driven entry and exit signals, commentary, and education. I use engineered algorithms to identify when to buy and sell ASX stocks. No biases or guesswork, just data driven signals.