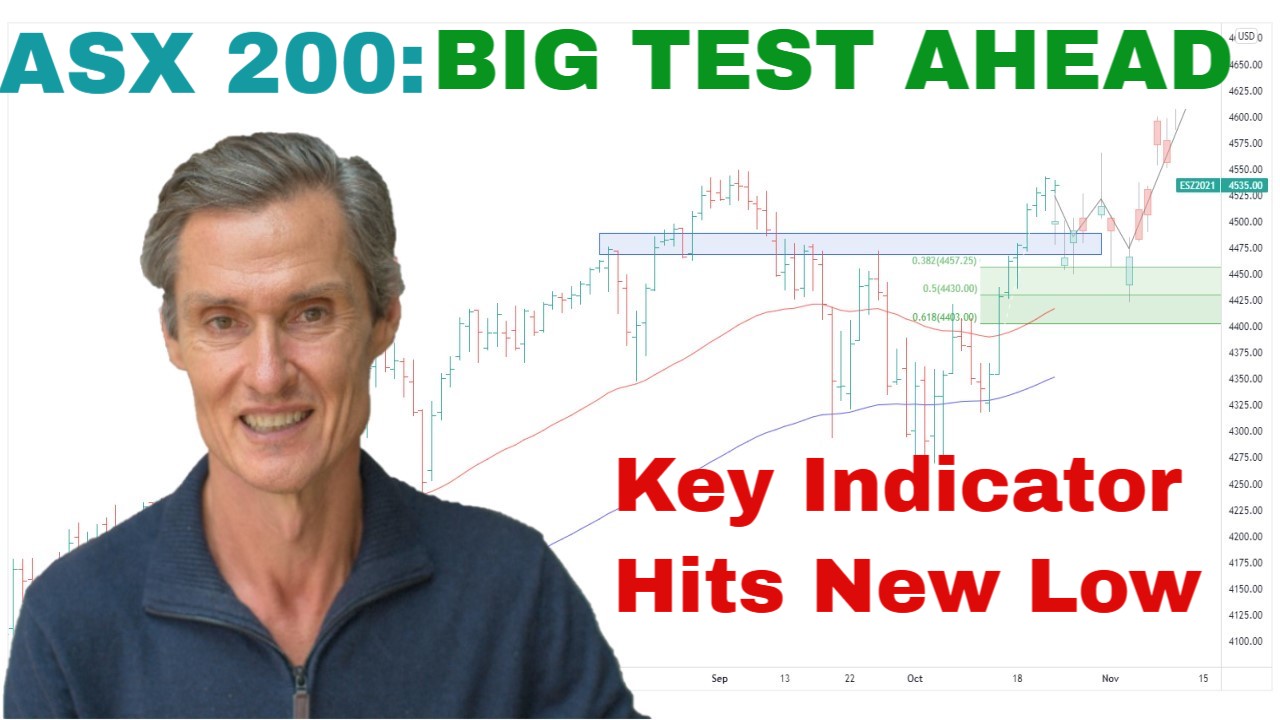
ASX 200 Technical Analysis: Record High — But Is It Truly Bullish? | Episode 302 (October 2025)

By Jason McIntosh | 17 October 2025
ASX 200 technical analysis this week comes with a twist: the index printed a new all-time high, yet the jury’s still out on whether this is the start of a sustained leg higher or a false break before more range-bound trade.
ASX 200: Breakout… or Just a Range Fake?
- The ASX 200 retested the 50-day MA twice in recent weeks, then pushed to a record high on Thursday.
- This follows a classic sequence: pullback to rising MAs → sideways compression → breakout.
- What matters now is follow-through. A brief push then reversal back into the prior range would flag a false break and likely more consolidation around the 50- and 100-day MAs (think June–July 2024).
Why I’m still bullish: price is above rising 50/100-day MAs and the index maintains a long-running pattern of higher highs and higher lows—hallmarks of an uptrend. If you’re building a shortlist, focus on stocks in strong uptrends and let breakouts do the heavy lifting.
Financials & Market Internals: Constructive
- ASX 200 Financials have been coiling along the 50/100-day MAs for ~two months (a bullish “pressure build”).
- A daily close above Thursday’s high would confirm a range breakout and add fuel to the broader market.
- The ASX 200 Equal Weight Index made a fresh all-time high this week. The ongoing leadership from mid/small caps confirms broad participation, which typically underpins durable advances.
- As breadth improves, having a ruleset to trade breakouts successfully becomes crucial.
Positioning: stay aligned with the trend, avoid chasing extended names, and use wide trailing stops to ride strength while managing risk.
S&P 500: Shock, Setback… then Stability
- After a sharp 3% down day last Friday, US indices quickly stabilised.
- Structure remains bullish: price is still above rising 50/100-day MAs with a persistent ladder of higher highs/lows.
- Expect more consolidation than collapse. Last week we highlighted a breadth cooling; that’s still the tension beneath the surface.
The Key Indicator I’m Watching
- The % of Russell 3000 stocks above their 100-day MA has been sliding for weeks. When this gauge drops below its own MAs, it often keeps falling for a while, translating to sideways or choppy indices, not necessarily tops.
- The S&P 500 Equal Weight just pulled back between its 50/100-day MAs after a false breakout—again, consistent with a digest-and-build phase before any renewed push.
Sentiment Check (AAII)
- Despite indices near highs, bearish responses ~46% are well above the long-term average (~31%), while bullish is below average.
- That’s not how major tops usually form (they tend to arrive with euphoria, not scepticism).
Playbook: remain long the trend, respect consolidation risk, and let your trailing stops define the exit rather than headlines.
Key Takeaways
- ASX 200: Record high posted; watch follow-through. A fade back into the range = more consolidation, but the primary trend remains up.
- Internals: Equal Weight leadership and financials’ coil are constructive for Aussie equities.
- US: Volatility spike likely a pullback within an uptrend; breadth suggests more chop before the next leg.
- Strategy: Own strength, buy valid breakouts, and keep wide trailing stops to ride the trend and control risk.
👉 For a deeper dive into technical analysis, check out our Weekly Strategy Sessions.
Motion Trader‘s algorithms scan more than 2,000 ASX stocks daily in search of medium term investment trends. We then tell our members precisely when to buy shares. And most importantly, we tell them when to sell.
Try a no obligation FREE 14-day trial of Motion Trader, and see what an algorithmic trading approach could do for you.
Take a Free 2 week Motion Trader trial
Video Timestamps
00:00 Intro
00:40 ASX 200: Why you should question this week’s record high
04:00 This sector is setting up for a breakout (be ready)
05:50 ASX is being dominated by this group
06:30 The key takeaway for ASX portfolios
08:30 S&P500 shocks some people (this is what they told me)
09:40 Is the S&P500 setting up for a big decline?
10:30 Look what the internal momentum is doing now
12:10 S&P500 Equal Weight gives a key insight
13:45 Fascinating survey (this doesn’t usually happen)

Jason McIntosh | Founder, Motion Trader
Jason’s professional trading career began over 3 decades ago. He’s a founder of two stock advisory firms, a listed funds management business, and has helped thousands of investors navigate the stock market. Click here to read Jason’s incredible story of, at age 20, sitting alongside some of the world’s greatest traders (and the life changing experience that came with that).

