ASX 200 Technical Analysis: Sharp Pullback or Start of a Bigger Fall? | Episode 304 (October 2025)
By Jason McIntosh | 31 October 2025
ASX 200 Technical Analysis: Sharp Pullback or Start of a Bigger Fall?
The ASX 200 has quickly given back much of its mid-October gains, sparking questions about whether this is the start of something bigger — or simply a healthy correction within an ongoing uptrend.
What the Price Action Is Saying
After several weeks of quiet trading, volatility returned on Wednesday following the latest inflation data. Despite the sell-off, the ASX 200 remains above its rising 50- and 100-day moving averages — a key signal that the dominant trend is still up.
The recent pullback looks corrective, not the start of a downtrend. Rising moving averages and a clear pattern of higher highs and higher lows continue to support a bullish backdrop.
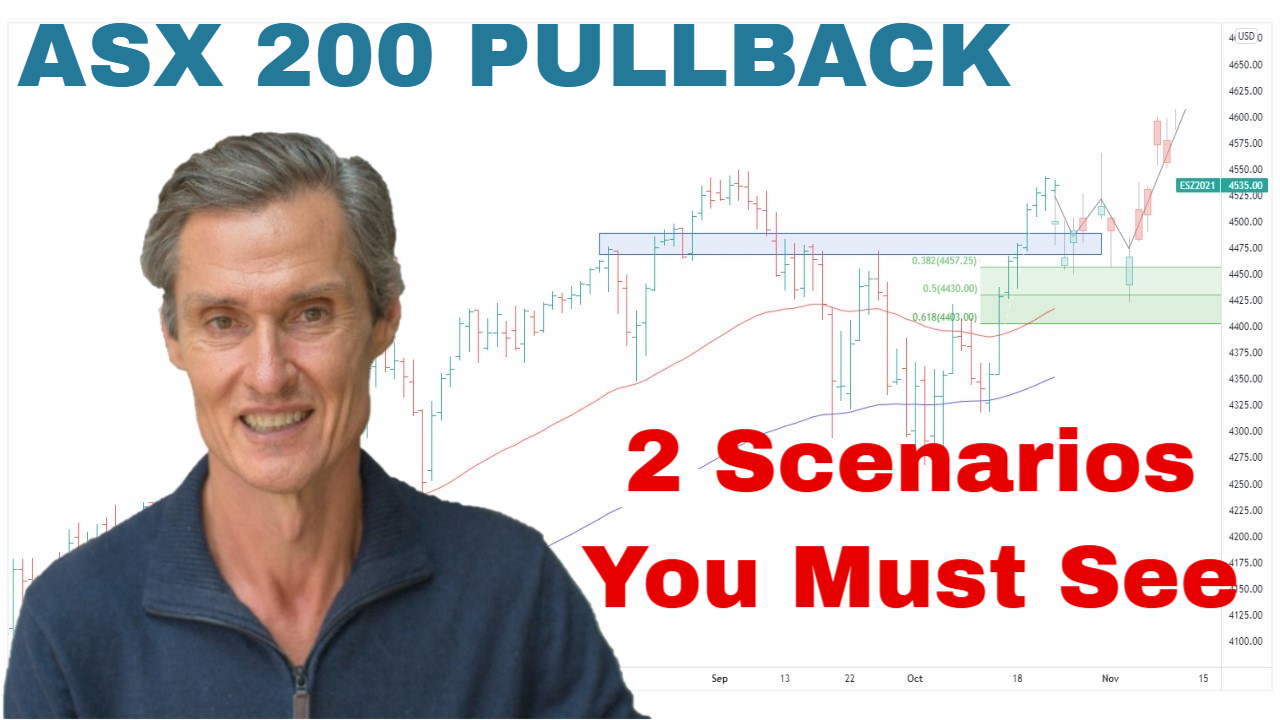
Two scenarios stand out:
- Shallow consolidation:
A narrow sideways range that allows moving averages to catch up — a setup that could later fuel a breakout to new highs. - Larger trading range:
A deeper consolidation, possibly retesting the 100-day MA or September lows before stabilising into year-end.
In both cases, price action suggests a correction within an uptrend, not a trend reversal.
Sector Check: Materials and Financials
The ASX 200 Materials Index remains one of the strongest charts on the market. It’s broken out of a three-year trading range and rallied ~15% from mid-September. A pause after that surge is normal — and likely healthy. Broadly, this structure supports the idea of a new, developing uptrend in the mining sector.
The Financials Index tells a similar story. After two months of consolidation, prices attempted a breakout before slipping back into the range. Despite the short-term setback, rising lows and sustained support at the 50-day MA suggest the market still wants to move higher, even if it’s not quite ready yet.
Broader Market Strength
The ASX 200 Equal Weight Index continues to show relative strength versus the headline index — a sign of broad participation beyond just a few large caps. While some consolidation is natural after months of gains, this broad-based structure is consistent with a healthy bull phase.
What It Means for Traders
Corrections within uptrends are normal. The key is to:
- Stay aligned with the trend.
- Avoid reacting emotionally to short-term volatility.
- Use wide trailing stops to ride consolidations without getting shaken out.
As long as price holds above key support levels and the moving averages continue to rise, the bullish trend remains intact.
Positioning principle: Stay with with the prevailing trend, focus on stocks in strong uptrends, and use wide trailing stops so consolidations don’t shake you out.
S&P 500: Records and Divergences
The S&P 500 has just recorded its 36th all-time high for the year, but not all stocks are keeping pace. The equal-weighted S&P 500 and the Russell 3000 breadth indicator show declining participation — fewer stocks remain above their 100-day MAs.
This divergence often precedes short-term consolidation, not necessarily a top. The major averages remain in uptrends, but momentum has cooled. That suggests a pause or pullback may be needed before the next leg higher.
US strategy: Respect the established uptrend. Rather than chasing extended names, trade breakouts successfully from sound bases. Trailing stops can then be used to manage risk.
Key Takeaways
- ASX 200: Pullback to 50-day MA looks corrective, not bearish.
- Materials: Consolidating after strong breakout — trend remains up.
- Financials: Dips being bought, structure bullish.
- Equal Weight: Broad participation supports underlying health.
- S&P 500: Record highs but narrowing breadth — watch for short-term consolidation.
Strategy: Stay long with wide trailing stops and manage risk. Consolidations are part of healthy uptrends.
👉 For a deeper dive into technical analysis, check out our Weekly Strategy Sessions.
Motion Trader‘s algorithms scan more than 2,000 ASX stocks daily in search of medium term investment trends. We then tell our members precisely when to buy shares. And most importantly, we tell them when to sell.
Try a no obligation FREE 14-day trial of Motion Trader, and see what an algorithmic trading approach could do for you.
Take a Free 2 week Motion Trader trial
Q1: Is the ASX 200 pullback a warning sign?
Not yet. The index remains above rising 50- and 100-day moving averages, suggesting the move is corrective, not a trend reversal.
Q2: Which sectors are holding up best?
Materials and Financials continue to lead, both maintaining bullish structures despite recent volatility.
Q3: What’s the outlook for US stocks?
The S&P 500 remains in an uptrend, though internal momentum has softened. A short-term consolidation would be normal after multiple new highs.
Video Timestamps
00:00 Intro
00:40 ASX 200’s quick sell-off (is a bigger fall coming?)
03:10 Be ready for one of these 2 scenarios
05:10 This is the key takeaway from last week
05:40 Don’t ignore what’s happening here (it’s a big deal)
10:00 But are the market internals weakening?
12:50 S&P 500 has NEVER done this before
14:30 Bullish on the surface (but did a big crack just open?)
17:10 Make sure you see this indicator – big insight to next move
20:20 I’m doing this now (and NOT doing this)

Jason McIntosh | Founder, Motion Trader
Jason’s professional trading career began over 3 decades ago. He’s a founder of two stock advisory firms, a listed funds management business, and has helped thousands of investors navigate the stock market. Click here to read Jason’s incredible story of, at age 20, sitting alongside some of the world’s greatest traders (and the life changing experience that came with that).
Meet Jason

I'm Jason McIntosh, the creator of Motion Trader. My career began in 1991 on the trading floor at Bankers Trust. Nowadays, I trade my own systems from home in Sydney.
Motion Trader is for investors who value robust analysis, data driven entry and exit signals, commentary, and education. I use engineered algorithms to identify when to buy and sell ASX stocks. No biases or guesswork, just data driven signals.