Trade the Trend | Episode 17
By Jason McIntosh | Published 25 November 2021
Trade the Trend is a weekly video focusing on where the stock market is going. It’s for investors and traders looking for insights to the market’s next move. Jason uses technical analysis and trend following techniques to help you piece together the world’s biggest puzzle.
Where is the Stock Market Going?
00:00 Intro
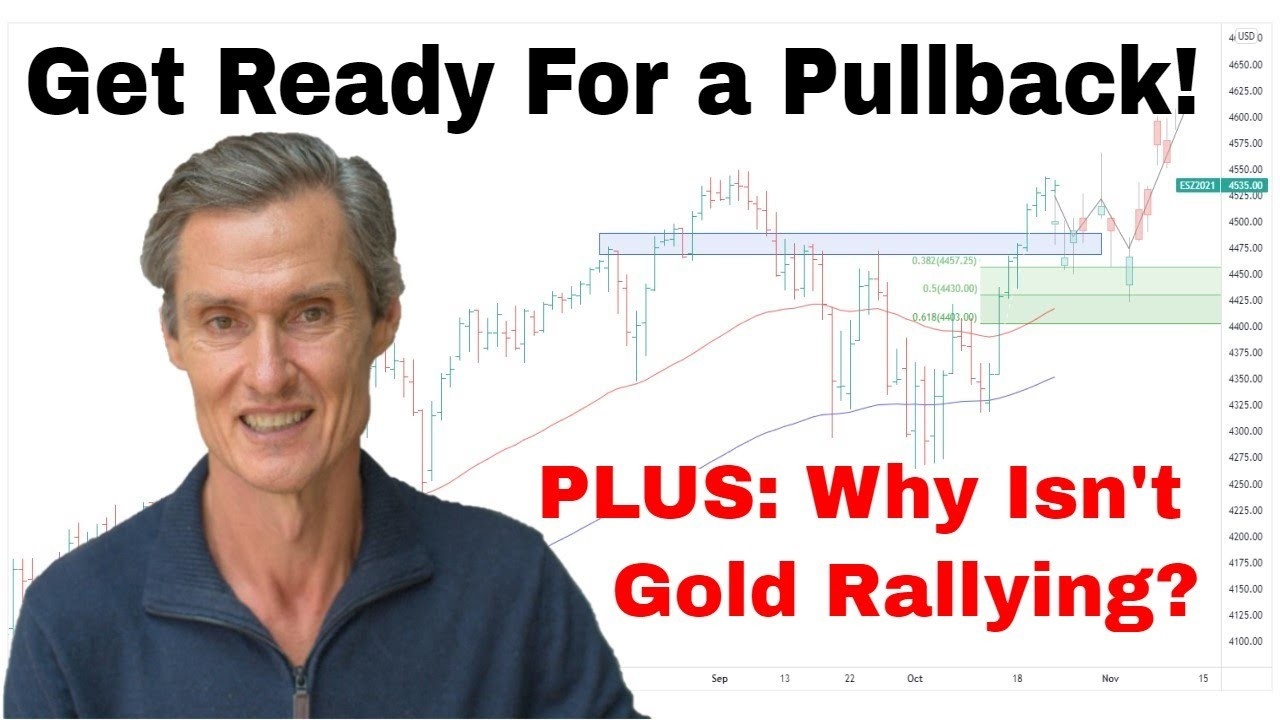
00:21 Where is the S&P 500 heading?
03:38 Where is the Russell 2000 heading?
05:40 Where is the All Ordinaries heading?
08:38 Where is gold going?
10:28 Where is the US dollar heading?
13:14 Where is silver going?
Where to invest now?
Looking for ASX stocks to buy now, as well as off the radar ideas most people don’t know? Our algorithms scan the stock market daily for medium term investment trends. We then tell our members precisely when to buy shares. And most importantly, we tell them when to sell.
If you’re ready to get started, try a no obligation FREE 14-day trial of Motion Trader, and see what an algorithmic trading approach could do for you.
Transcript
Please note: Charts available from video
Welcome to this week’s edition of “Trade the Trend,” a weekly video discussing where the stock market is going. I’m Jason McIntosh. It is Friday, the 25th November 2021. As always, this is a general commentary and doesn’t take your personal situation into account.
All right. With that said, let’s jump straight to the first chart. So S&P 500, well, we’re starting to see some consolidation develop. This is what we’ve been talking about over the last couple of weeks. Look, we have this really strong move off the September lows, and it was just a matter of time before that rally had to get checked. It had to get checked.
We had to see some consolidation develop. And that’s pretty much now what we’re starting to see. Look, I think there’s probably some more in this at this point. Look, I think we’re going to see this market possibly pull lower. So, getting some ideas where that could be to. We can put a Fibonacci retracement on.
We can measure the whole move from start to the current top. Maybe there’s going to be a new top next week, we don’t know. But let’s just use this for now and make an assumption that this could be a top.
So, you look at Fibonacci as well. It’s possible we see the market come back down towards this 38.2% range. Let’s put some moving averages on the chart. So, this is interesting when you look at this as well.
So, I’ve got the 50-day and the 100-day. So, there’s a possibility we see the market come back towards this pocket in here where it collects the 50-day moving average and the top of the Fibonaccis.
That’s the sort of thing we could say. It wouldn’t be dissimilar to this is period in here where we had the rally off the lows, and then there was a pullback and consolidation came back and collected the 50-day moving average. Look, I don’t expect it to play out exactly like that.
That’s just an example of what could happen around here. So look, at some point, it has got to be said, a bigger correction is inevitable. And that’s a correction of the order of 10% to 15%, possibly even more, but there’s no obvious sign of that at the moment.
So, I think the strategy is to stay with the trend. The trend is clearly still up. We’ve been in this big upward trend for, look, geez, over 18 months now. So, let’s give that trend the benefit of the doubt.
And I know it can be uncomfortable staying with these longer-term trends because you’re always guessing when is it going to end. Was it going to end here? Was it going to end here? Here? Was this the end? Is this the end? Look, who knows? We don’t know and this is the thing. So, I think it’s all about giving that trend the benefit of the doubt.
It can be uncomfortable, but you can be waiting a long time for the market to agree with you if you want to take that really cautious and bearish position and jump out of the market like people do all the way along and say, “Okay. That’s enough, I’ll jump out and wait now.” Who knows?
You just don’t know where the top is. So, as I keep saying, I think the strategy is stay with the trend until we have signs of where that trend ends.
So, let’s jump and have a quick look at the Russell 2000, the U.S. small-caps. Look, this has been really interesting because we had this really good breakout a few weeks ago now and we had an initial rally out of there and now we’ve come back within the range.
And so, look, you always expect a market to pull back as we’ve just been talking about with the S&P.
But when you break out of a range, market breaks out of a range, ideally, you want to see it hold above this sort of level here at the top of the range. So, I would have liked to have seen something like maybe this develop where it holds above the range, moves sideways for a bit, and then starts to move higher.
That would have been textbook. Textbook is lovely when you get textbook. Unfortunately, you don’t get textbook moves all the time. What we have now is a move back within the range.
So, look, that doesn’t nullify or invalidate the bullish potential of this patent but, look, it is a little bit of a warning flag that this market may not be as strong as I initially hoped it could be after breaking out of a nine-month-long trading range.
And it just serves as a reminder why we can never get complacent about a market and have these expectations that a market is going to do X or is going to do Y because we don’t know.
We can look for possibilities and that’s what we do, but you can never get certainty. So, my approach with these things is you’ve just always got to know where your exits are. So, we don’t know what the market is going to do next, but we know what we’ll do.
So, with this one here, it’s just giving us a warning that maybe the market underlying strength isn’t all that it could be at the moment. So, it’s just one to watch. Watch and keep an eye on for now.
So, the local market. Well, look, this resistance band we’ve been looking at for a while now, it’s been so tough for the market to get through. Comes in around right about 7,800. Market has been banging its head up against this for a good four weeks through this period.
It hasn’t been able to get through it. Now, today, on Friday, we’re starting to see the market push back lower again like we did here and here.
And on these occasions, the market reversed and went back up and had another test of resistance. Looks like we’re going to close below the 50-day and the 100-day moving averages because this is around 2:40 on Friday afternoon.
Look, there’s a chance that we’re going to see this market continue to drift back. And then in which case, we start looking at this…are we going to get a retest of the support down here? So, the longer it takes to get through here, the more likely I think it is that we’re going to drift back towards the bottom of this band we’ve been in for the last few months.
So, all in all, I think that the overall trend is still firmly up as I keep saying. So, I’m not looking for a major top. That could form, but I don’t see the clear evidence of that at this point. That said, I wouldn’t be buying dips right here. I’d like to see how this plays out before I start looking for opportunities to start buying.
That said, I have been buying stocks through the week, but they’re stocks with upward momentum.
I’ve been buying with upward momentum, not buying something which is pulling back, pre-empting it to turn and go back out. It works well when you get a clear upward trend, immediate upward trend. But at the moment, we’ve got this churning which is going on in the market. So, I think there’s a possibility that we do come back and retest.
So, I think the old ordinaries like the Russell, just a cautious stance while we see how the market plays out. And as I’ve been saying, I’m using wide trailing stops on my portfolio.
So, the aim of a wide trailing stop is you can see off bouts of moderate weakness, which typically come in during any advance. There are always going to be bouts of moderate weakness.
And those wide trailing stops help see them off. Eventually, a bigger correction will take out your wide trailing stops, but hopefully, that helps you stay on trend for longer. And that’s what I do with my Motion Trader service. I calculate those exit levels so we know where. We know precisely when to get out of a trade. Okay.
Now, if you’re getting some value from this, please hit that like button. Let YouTube know that it’s of value, and then YouTube will keep showing other people, which means I’ll keep making the videos. And also, please hit the subscribe button with the bell notification.
All right. With that said, let’s go and have a look at some commodities. So, I want to have a look at gold today because gold has had a bit of an interesting week. We had a clear… We talked about it as being a breakout, but I did say for time, it wasn’t…it’s a triangle pattern.
And I remember saying something along the lines of it wasn’t the nicest looking triangle, but we had a breakout.
And you have a breakout, give it the benefit of the doubt. See if it runs. Well, it did run for a bit, and now it’s given back pretty much all the advance. So, that’s not what you want to see. A bit like the Russel.
I would have liked to have seen it hold on to a lot of these gains, hold up at least around this level, and then start to roll higher again.
It hasn’t done that, it’s come all the way back. Look, I don’t think that’s bearish for gold, I just think it’s a signal that gold is not ready to go.
And I think it’s a case that we’re probably going to see…my guess would be that we’re going to see more of this, more of this sideways action over the next…maybe over the next few months just seeing the market move around not really going up, not really going down.
The level for me to watch now is just around here. Let’s say about 1,900, possibly a bit lower, maybe around here, maybe around 1,890. Just above this peak here. Market gets above there, I’ll start getting interested again. But for now, I think gold is trading sideways.
It’s just the time is not right. I think gold’s time will come, but it just doesn’t seem to be here at the moment.
And just on what could be a headwind for gold, haven’t looked at the U.S. dollar for a while, but this is the U.S. dollar index. So, that’s index of the U.S. dollar against a basket of a whole lot of other currencies. And the U.S. dollar has been quite strong over the last few months. And when the U.S. dollar is strong, it’s a natural headwind for gold.
Gold can rise with a strengthening dollar, but they tend to do the inverse of one another. So, there’s no…doesn’t look to be any sign of this moving in the dollar stopping other than for some sort of pause to consolidate this move up. It looks like there’s more upside in the dollar.
And then when I look at it, it’s interesting to go and have a look at this on a longer-term basis. Look at it on a weekly chart. Let’s get some more data. And yeah.
So, you look at this on a weekly chart. If I was just looking at this in isolation, I’d be saying I’m bullish on this chart because what you can see developing here, you can see this consolidation range, which has been forming.
Yeah. You got this consolidation. So, we’ve got this big impulsive upward move and now we’ve got a sideways, what looks to be a consolidation. And now bear in mind, this is a longer-term chart, this is 2016. This has taken five years to play out. So, this isn’t something which is going to drive gold next week or next month for that matter.
But just looking at this on its own, we’ve got another pattern down here. We’ve got the sideways consolidation, and then we’ve got the big move up from. Look, this is… I always say it’s about knowing possibilities.
So rather than just saying, “Look, I’m bullish on gold. Gold’s got to go up.” What’s the other side of that? What could go wrong? What could go wrong with that view? And this is one of the things that could go wrong with it.
If the dollar continues to coil within this pattern, then starts to break to the top side, that’s a pattern which could develop. Mind you this is over a number of years. I’d expect that to play out two, three years. So, it’s not a play for right now. But yeah. It’s something to be mindful of with the gold story.
I really like the gold story medium-term, but in the back of my mind, I’m thinking what if the U.S. dollar goes into a large longer-term rally? I don’t know what drives it.
A lot of people are very bearish on the dollar, but who knows. The market doesn’t do what everyone thinks it’s going to do a lot of the time. So, just a point to be aware of. And while we’re on commodities, let’s jump briefly to silver. Where have my commodities gone? Here we go. So, we were looking at this last week. Let me just jump back to the daily chart.
We were looking at silver last week. The last couple of weeks, actually. And so yeah. So, silver has been in this big range for quite a while going back 18 months or so. And the last couple of weeks, I’ve been talking about this inverse head and shoulders pattern. We had the neckline through there, we had the break out, we had the consolidation.
And last week I said, “Well, look, this is it. It’s either going to bounce off this and start moving up towards the upper end of the range, or the pattern is going to fail. It’s going to pull back.” Well, the pattern has failed. So, it removes that immediate bullish scenario from the table and it just looks like gold is still stuck in this sideways band. Now is not the time.
So, look, keep watching them. I know a lot of people would love gold and even silver to really go on a big run. I know there are a lot of people who are just always bullish on these things, but sometimes the setup is just not there.
And when it’s not there, it’s often best just to put it to the side burner, go off and look at other opportunities for a while. These will shape up at some point, but it just doesn’t look like it’s now.
And lastly, I’m just going to finish with a stock which I was looking at last week with you, this Zimplats Holdings. Well, look this didn’t quite go as I thought it could. So, we had this breakout of this pattern here. We had a nice breakout. And then with the precious metals in general how they pull back swiftly during the week, the same has happened for Zimplats.
It’s come back within the range. It’s invalidated that immediate bullish story that it built through the charts. And look, that’s the thing with these markets, nothing works all the time. It’s all about balancing your risk with reward and then making decisions according to that.
Sometimes these patterns work out beautifully. There’s an example on this chart. You look at this one down here, and it was great. Broke up and never look back.
Doesn’t always go that way. So, it’s like you can have a four of a kind in poker and you can still lose the hand. So, it’s all about being able to manage your risk so you can come back and play the next hand and playing the odds. That’s what this is all about. Playing the odds, look at the possibilities, getting the risk-reward in your favor, and then placing your bets.
So, look, let’s leave it there. Let’s call that a wrap for this week. Hope you got something out of that. Please give me a like if you did. And I look forward to coming back and helping you put all the pieces together next week. Thanks for joining in.
Meet Jason

I'm Jason McIntosh, the creator of Motion Trader. My career began in 1991 on the trading floor at Bankers Trust. Nowadays, I trade my own systems from home in Sydney.
Motion Trader is for investors who value robust analysis, data driven entry and exit signals, commentary, and education. I use engineered algorithms to identify when to buy and sell ASX stocks. No biases or guesswork, just data driven signals.