ASX 200 Technical Analysis: Rally or Reversal? History Suggests What Comes Next | Episode 301 (October 2025)
By Jason McIntosh | 10 October 2025
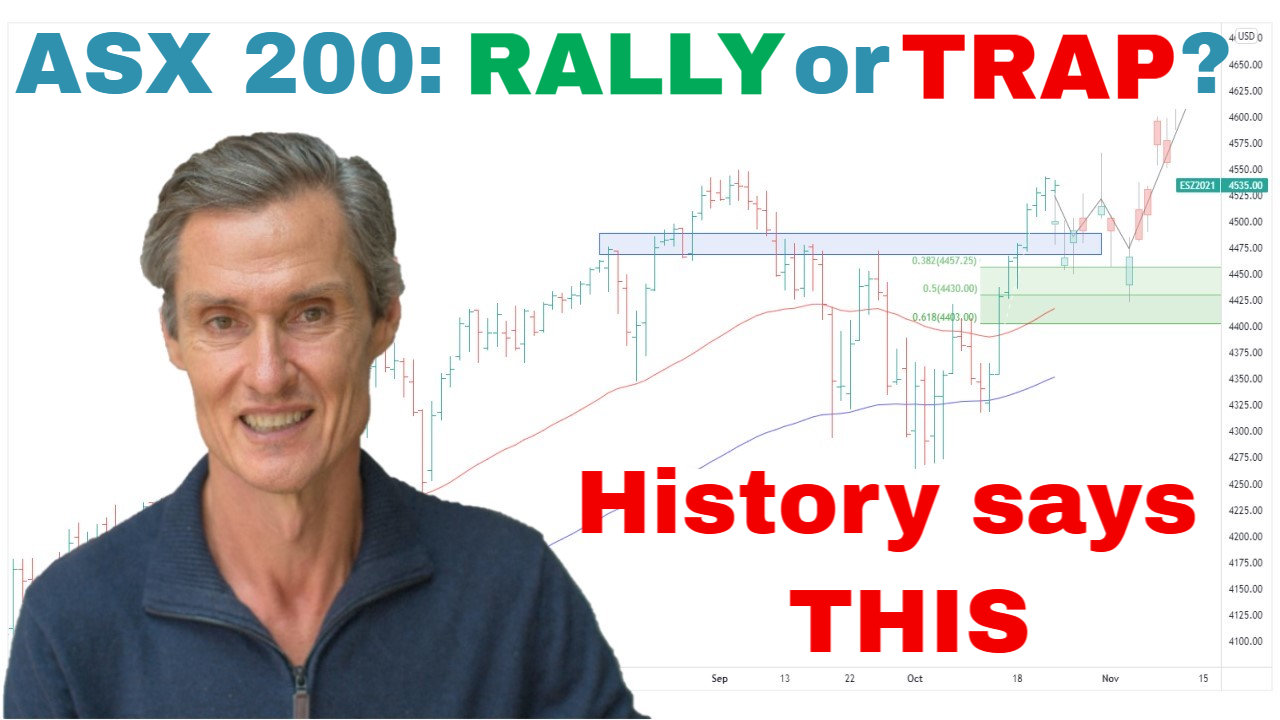
ASX 200 Technical Analysis: Consolidation Within an Uptrend
The ASX 200 spent the week consolidating after last week’s sharp rally off the 50-day moving average. Prices have given back only a small portion of recent gains, which is a positive sign of dip-buying behaviour rather than weakness.
The index continues to hold above both its 50- and 100-day moving averages, maintaining a well-defined series of higher highs and higher lows. These are classic markers of a healthy uptrend.
While the market could certainly break to new highs soon, a longer consolidation—similar to what occurred in May–June 2024—is also possible. Either outcome fits within the structure of an ongoing bullish trend. The key is to stay aligned with the trend rather than react to day-to-day volatility.
Learning to identify stocks in strong uptrends helps investors stay confidently positioned through these pauses instead of getting shaken out.
Mid and Small Caps Taking the Lead
While the large-cap segment has paused, mid-caps and small-caps are rallying strongly.
This can be clearly seen in the ASX 200 Equal Weight Index, which removes the outsized impact of mega-caps.
Since the ASX 200’s all-time high on 25 August, the Equal Weight Index has gone on to make a series of new highs—proof of broad-based participation across the market.
This internal strength shows that the current advance is not driven by a narrow group of leaders but by a broad foundation of buyers, a hallmark of sustainable bull markets.
When the market broadens like this, it often precedes the next phase of major uptrends. Knowing how to trade breakouts successfully can help you capture those emerging opportunities as momentum spreads through more stocks.
Positioning for the Next Move
Whether the next leg higher comes soon or after more consolidation, the underlying structure remains bullish.
Portfolio strategy at this stage should emphasise:
- Staying long within the trend
- Avoiding the urge to time every short-term dip
- Using wide trailing stops to stay on strong trends while managing risk
This approach removes emotion and lets the system guide when to exit — the cornerstone of the Motion Trader method.
S&P 500 Technical Analysis: Surface Stability, Internal Shifts
Over in the US, the S&P 500 has held steady near record highs, supported by the Magnificent 7 mega-caps, which together represent about one-third of the index. These large stocks have spent the last three weeks in a tight consolidation range, helping to stabilise the broader market.
That price action remains constructive — a compression following strong gains, with both the 50- and 100-day MAs trending higher.
However, when we strip out those big names, a different picture emerges. The S&P 500 Equal Weight Index has been mostly sideways for seven weeks, showing false breaks both up and down, signalling hesitation rather than weakness.
A Key Breadth Indicator Weakens
A deeper look at market breadth reveals what’s happening below the surface. The percentage of Russell 3000 stocks above their 100-day moving average has fallen from 77% in late August to about 55% today.
This isn’t necessarily bearish — similar declines during 2024 merely marked temporary consolidations while the S&P 500 continued trending higher.
The lesson: a cooling breadth indicator doesn’t always warn of a top; it often signals that the market is digesting gains before moving higher.
Five Up Months in a Row — What History Says
Despite recent pauses, the S&P 500 has now logged five consecutive monthly gains. Since 1945, when this has happened, the market was higher a year later in 94% of cases, with a median return near 12%.
History doesn’t guarantee the future, but it does highlight how momentum tends to persist longer than expected.
That’s why the best course remains simple: stay long the trend, manage risk prudently, and let the system capture the next wave.
Key Takeaways
✅ ASX 200: Holding firm after rally; consolidation likely within an ongoing bullish trend.
✅ Breadth: Equal Weight Index and small/mid-caps leading higher — a strong internal signal.
✅ S&P 500: Stable at highs; short-term breadth softening but trend still intact.
✅ Strategy: Follow the trend, use wide trailing stops, and focus on process over prediction.
👉 For a deeper dive into technical analysis, check out our Weekly Strategy Sessions.
Motion Trader‘s algorithms scan more than 2,000 ASX stocks daily in search of medium term investment trends. We then tell our members precisely when to buy shares. And most importantly, we tell them when to sell.
Try a no obligation FREE 14-day trial of Motion Trader, and see what an algorithmic trading approach could do for you.
Take a Free 2 week Motion Trader trial
Video Timestamps
00:00 Intro
00:40 Is the ASX 200’s bullish structure intact?
02:40 This scenario from 2024 may be about to repeat
03:50 Why you don’t need to predict the next move to make money
04:40 Mid-cap outperformance means THIS for ASX
08:05 S&P 500’s biggest influence sets-up for next move
10:50 But look what’s happening below the surface
12:10 Key indicator makes a new low (is it an early warning?)
17:50 Could this remarkable statistic play out again?

Jason McIntosh | Founder, Motion Trader
Jason’s professional trading career began over 3 decades ago. He’s a founder of two stock advisory firms, a listed funds management business, and has helped thousands of investors navigate the stock market. Click here to read Jason’s incredible story of, at age 20, sitting alongside some of the world’s greatest traders (and the life changing experience that came with that).
Meet Jason

I'm Jason McIntosh, the creator of Motion Trader. My career began in 1991 on the trading floor at Bankers Trust. Nowadays, I trade my own systems from home in Sydney.
Motion Trader is for investors who value robust analysis, data driven entry and exit signals, commentary, and education. I use engineered algorithms to identify when to buy and sell ASX stocks. No biases or guesswork, just data driven signals.