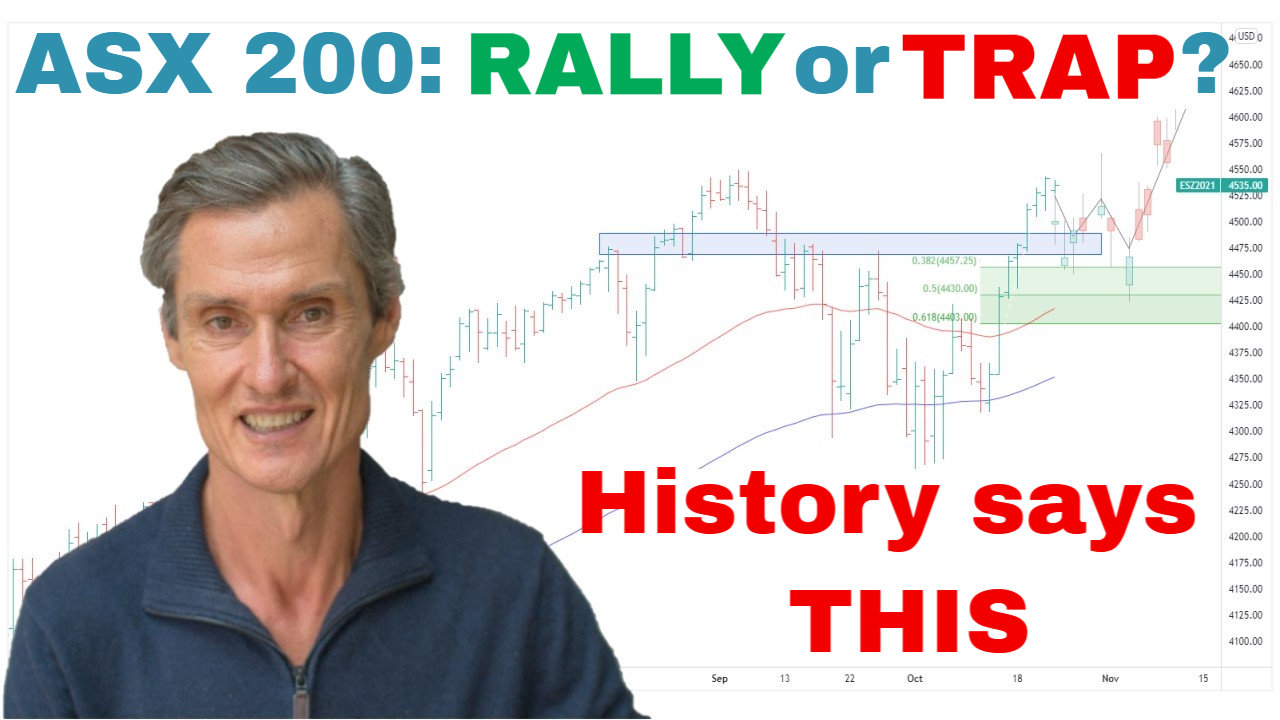
ASX 200 Technical Analysis: Rally or Trap? What History Suggests Happens Next | Episode 300 (October 2025)

By Jason McIntosh | 3 October 2025
ASX 200 Technical Analysis: Support Holding After Shallow Pullback
The ASX 200 continues to trade around its 50-day moving average, finding repeated support after the 4% pullback from August’s all-time high. While momentum hasn’t yet re-accelerated, the pattern still reflects buy-the-dip behaviour rather than trend exhaustion.
Importantly, the index remains above its 100-day moving average, reinforcing that this appears to be a consolidation phase within an ongoing bullish trend rather than a reversal.
When you understand how to identify stocks in strong uptrends, it becomes easier to ride these pauses rather than fear them — this is how trend followers stay positioned through noise.
Materials and Financials Leading the Charge
Two heavyweight sectors — materials and financials — are displaying constructive setups.
- The ASX Materials Index has broken above its moving averages after more than three years of sideways trading, with price now establishing a new base above support.
- The ASX Financials Index continues to consolidate along a rising 50-day MA, suggesting underlying buying strength.
Both sectors are key components of the ASX 200, and their stability supports the case for higher levels once the current consolidation resolves.
A Healthy, Broad Market Beneath the Surface
The ASX 200 Equal Weight Index remains above its own 50-day moving average and recently hit a new all-time high.
That broad participation shows a healthy underlying market, not one reliant on a few large caps.
This type of strength is what defines durable uptrends — not just rallies driven by short-term sentiment.
When you learn to trade breakouts successfully, you can spot the kind of structural strength that fuels sustained market moves.
S&P 500 Technical Analysis: Five Straight Monthly Gains
Across the Pacific, the S&P 500 has now logged five consecutive up months and recently posted its 14th-best September on record, gaining 3.5%.
History suggests that when September is strong, the final quarter often continues higher — in 11 of the last 13 instances since 1950, October–December also produced gains.
Price structure remains bullish, with rising 50- and 100-day moving averages and a clear pattern of higher highs and higher lows. The recent consolidation was brief, and both the S&P 500 and Equal Weight Index made fresh all-time highs last week.
Momentum like this often persists longer than expected, highlighting the power of staying invested with wide trailing stops to manage risk while participating in strength.
Global Confirmation: Europe Joins the Rally
Europe’s Euro Stoxx 50 Index just broke out of a four-month consolidation to new highs, aligning with the global bullish tone.
When major regions trend together, it reinforces confidence that the broader uptrend remains intact.
Key Takeaways
✅ ASX 200: Shallow pullback holding above 50-day MA. Structure remains bullish.
✅ Sectors: Materials and Financials leading with improving setups.
✅ Breadth: Equal Weight ASX 200 making new highs — broad participation intact.
✅ S&P 500: Record highs with strong momentum and historical tailwinds.
✅ Strategy: Stay long, manage risk with wide trailing stops, and trust the process through consolidations.
👉 For a deeper dive into technical analysis, check out our Weekly Strategy Sessions.
Motion Trader‘s algorithms scan more than 2,000 ASX stocks daily in search of medium term investment trends. We then tell our members precisely when to buy shares. And most importantly, we tell them when to sell.
Try a no obligation FREE 14-day trial of Motion Trader, and see what an algorithmic trading approach could do for you.
Take a Free 2 week Motion Trader trial
Video Timestamps
00:00 Intro
00:40 ASX 200: This is a big deal (look what just happened)
03:20 Key sector is turning bullish after 3.5 years
05:35 These leading stocks are nearing a breakout
06:30 This is how I’m positioning now
09:40 S&P 500’s new record high (and an important message)
10:50 This has only happened 14 times since 1950
12:10 History says THIS could happen by year-end
13:35 S&P 500 Equal Weight just give an important insight

Jason McIntosh | Founder, Motion Trader
Jason’s professional trading career began over 3 decades ago. He’s a founder of two stock advisory firms, a listed funds management business, and has helped thousands of investors navigate the stock market. Click here to read Jason’s incredible story of, at age 20, sitting alongside some of the world’s greatest traders (and the life changing experience that came with that).

