ASX 200 Rebound Stalls — Is a Bigger Sell-Off Coming? | Episode 308 (November 2025)
By Jason McIntosh | 28 November 2025
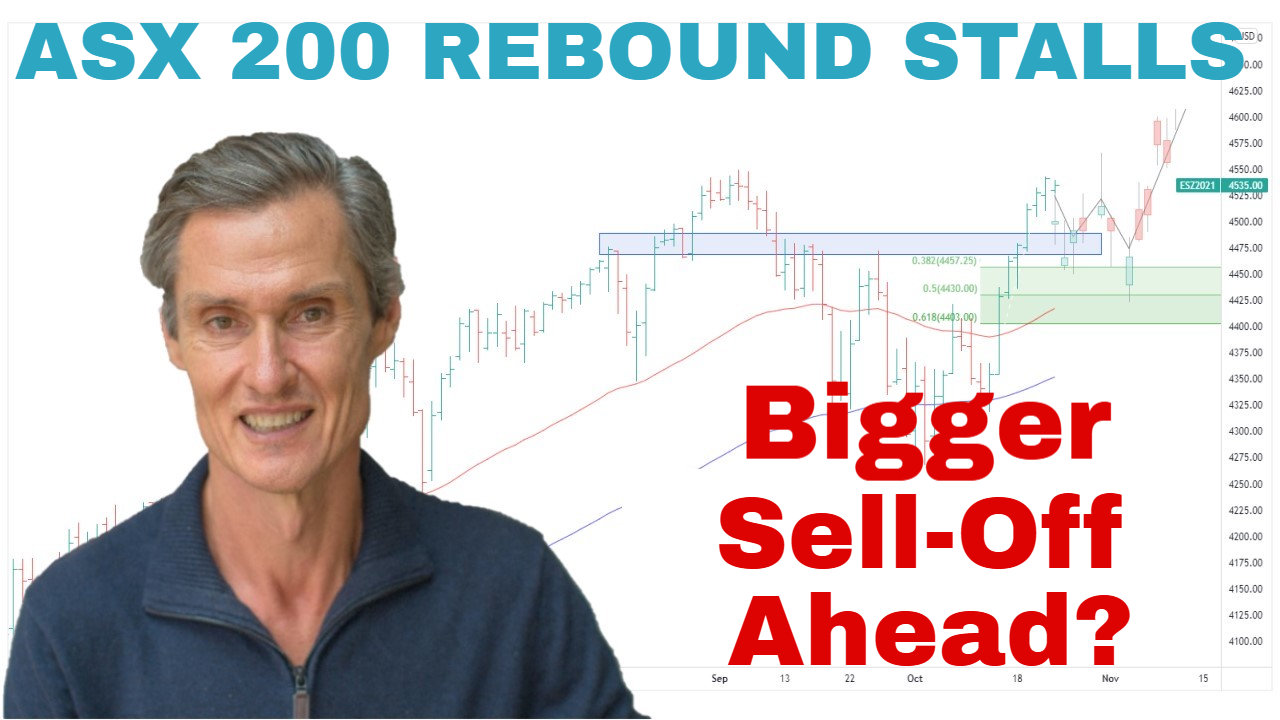
ASX 200 Technical Analysis: The Bounce That’s Not Convincing…. Yet
This week’s price action delivered two very different stories across the Australian and US markets.
On the ASX, the rebound remains shallow and indecisive, with the index struggling beneath former support at 8,600. Meanwhile, the S&P 500 has staged a strong rally off the 100-day moving average, bringing prices back within 1.5% of all-time highs.
Let’s break down what’s driving the divergence — and what it may mean for the weeks ahead.
ASX 200: A Shallow Bounce Beneath Resistance
Last week’s breakdown below 8,600 introduced our first yellow flag — not a bearish signal, but an early sign of potential structural change.
This week confirms the concern:
- The rebound is disproportionately shallow
- The former support at 8,600 is now acting as resistance
- Both the 50-day and 100-day moving averages are beginning to roll over
When rebounds are weak and occur beneath declining moving averages, trend followers watch closely for the shift from buying the dip to selling the rally.
Why the Rebound Shape Matters
A V-shaped rally (like April and August last year) reflects aggressive dip buying.
A shallow bounce reflects the opposite — sellers leaning into strength.
Nothing is confirmed yet, but this is the structure that often precedes further volatility.
Related reading: we buy strength and use rules to manage exits — see
ASX Breakout Strategy and
How to Find ASX Stocks in a Strong Uptrend.
Financials: The Biggest Weight on the ASX
The ASX 200 Financials Index shows the exact pattern that weakens broader market momentum:
- Sharp sell-off
- Shallow rebound
- Price stuck beneath declining averages
This setup often leads to a retest of the recent lows, as we saw in February.
This weak structure explains why the ASX 200’s bounce is struggling — financials simply aren’t providing support.
But financials alone rarely drive a deep ASX decline.
That’s where materials come in.
Materials Remain a Vital Counterbalance
In contrast to financials, the ASX 200 Materials Index continues to show a bullish structure:
- Price is above rising 50- and 100-day moving averages
- Materials are breaking out of a three-year trading range
- The current consolidation is occurring on top of rising averages
This makes a major market-wide decline less likely.
March vs Now: Why This Time Is Different
In March:
- Materials were below declining averages
- Financials were also weak
- Breadth was deteriorating
That combination made the ASX vulnerable.
Today:
- Materials are trending higher
- Breadth is healthier
- Equal-weight indices are holding up
This stabilising effect reduces the probability of a deep sell-off.
Equal-Weight ASX 200: A Healthier Picture Beneath the Surface
While the headline ASX 200 looks soft, the equal-weight version shows:
- A stronger, more V-shaped rebound
- Less drag from the big four banks
- A 7% pullback inside a 37% uptrend
This perspective supports the idea that we’re in a normal consolidation, not the start of a major downtrend.
My own trading reflects this:
- I’ve sold several stocks (some profits, some moderate losses)
- I’ve also bought new positions in recent days
- I continue to follow my systematic, rules-based plan
That’s the advantage of a clear strategy: you build it when conditions are calm, then follow it when the market gets difficult.
S&P 500: A Strong Rally Off the 100-Day Moving Average
Just last week, sentiment was turning pessimistic:
- Thursday saw a high-to-low reversal
- Friday opened near the lows
- Fear was rising across US stocks
But almost immediately, buyers stepped in.
The S&P 500:
- Rebounded sharply from the 100-day moving average
- Is now within 1.5% of a record high
- Remains in a clear uptrend from the April lows
Retracements to the 100-day moving average are common in bull markets. They often set the foundation for the next leg higher.
Participation Is Improving — and That’s Crucial
The biggest issue for the US market has been narrow participation, driven by the Magnificent 7.
But this week brought two positive developments:
1. Equal-Weight S&P 500: False Break and Strong Reversal
Last week’s breakdown from a two-month range:
- Failed to attract follow-through
- Reversed sharply
- Returned to the top of the range
False breaks to the downside are often bullish markers — they signal selling exhaustion.
2. Surge in Market Breadth: Russell 3000 Indicator
The percentage of stocks above their 100-day moving average surged from:
35% → 52% within a week
That’s exactly where moderate pullbacks often end.
For the bull market to continue, this reading now needs to:
- Hold above 50%
- Ideally push into the 60–70% zone
Fear Spiked — Another Positive Sign for Stabilisation
Put-option volume surged this week, reflecting:
- A sharp spike in hedging
- A rise in fear
- Portfolio insurance demand
Historically, the largest spikes in put volume tend to align with swing lows.
Not perfect — but a useful sentiment gauge.
Overall US Market Outlook: Pullback Within an Uptrend
Combining all the evidence:
- Trend = Up
- Participation = Improving
- Equal-weight = Bullish false break
- Breadth = Rebounding sharply
- Sentiment = Fearful (not complacent)
This is classic bull-market pullback behaviour, not the start of something bigger.
As always:
Don’t get caught in the emotion of the moment.
Follow your rules. Manage risk consistently.
This is how pullbacks become tolerable — and sometimes profitable.
👉 For a deeper dive into technical analysis, check out our Weekly Strategy Sessions.
Motion Trader‘s algorithms scan more than 2,000 ASX stocks daily in search of medium term investment trends. We then tell our members precisely when to buy shares. And most importantly, we tell them when to sell.
Try a no obligation FREE 14-day trial of Motion Trader, and see what an algorithmic trading approach could do for you.
Take a Free 2 week Motion Trader trial
Q: Is the ASX 200 breakdown a bearish signal?
Not yet. The shallow rebound is a yellow flag, but materials strength and equal-weight resilience suggest a pullback, not a major trend change.
Q: Why are financials dragging on the ASX?
Financials show a weak technical structure: a sharp fall, shallow bounce, and price below declining moving averages — a pattern that often precedes retests of lows.
Q: Is the S&P 500 pullback over?
There are signs of stabilisation: a strong rebound off the 100-day MA, improving breadth, and a bullish false break in the equal-weight index. Trend remains up.
Q: What signals a healthy US bull market?
Sustained participation. For ongoing strength, the percentage of stocks above their 100-day moving average needs to stay above 50% and trend higher.

Jason McIntosh | Founder, Motion Trader
Jason’s professional trading career began over 3 decades ago. He’s a founder of two stock advisory firms, a listed funds management business, and has helped thousands of investors navigate the stock market. Click here to read Jason’s incredible story of, at age 20, sitting alongside some of the world’s greatest traders (and the life changing experience that came with that).
Meet Jason

I'm Jason McIntosh, the creator of Motion Trader. My career began in 1991 on the trading floor at Bankers Trust. Nowadays, I trade my own systems from home in Sydney.
Motion Trader is for investors who value robust analysis, data driven entry and exit signals, commentary, and education. I use engineered algorithms to identify when to buy and sell ASX stocks. No biases or guesswork, just data driven signals.