ASX 200 Rally Stalls — Is a Breakdown Coming? | Episode 309 (December 2025)
By Jason McIntosh | 5 December 2025
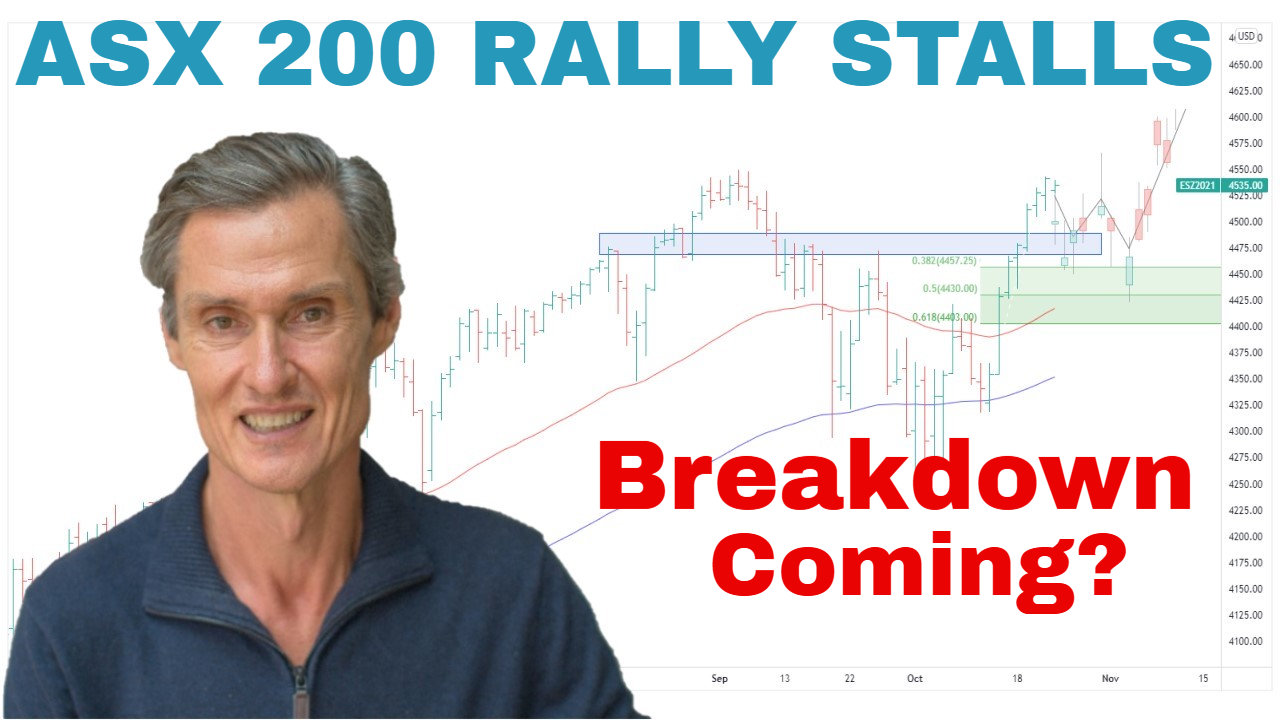
ASX 200: Capped Below 8,600 — But Holding Gains (That Matters)
The ASX 200 has been stuck beneath overhead resistance near 8,600 for more than a week. Price is also consolidating below declining 50- and 100-day moving averages, which usually raises vulnerability.
Here’s the important nuance: despite that setup, the index has held onto its gains off the November low. That behaviour suggests the dip is being bought, not that rallies are being sold — a key distinction when price sits beneath rolling averages.
What to watch: a decisive push through 8,600 and a move back above the MAs would confirm buyers reasserting control. A prolonged stall with lower highs would re-open retest risk.
Financials: Retest, Reversal Day, and a Chance to Rebound
Financials did what shallow bounces often foreshadow — they retested the lows and made a marginal new low on Thursday. But Thursday’s session finished with an intraday downside probe and strong close on the highs — a classic early sign of seller exhaustion.
Measured against the Fibonacci retracement of the April–October advance, the pullback has reached the upper retracement zone, which is proportional rather than trend-ending. The primary uptrend in financials remains intact on the larger timeframe.
Next step: watch the character of the next rally.
- Strong = punch back toward the MAs (buyers returning).
- Lacklustre = languish under MAs (vulnerability persists).
If financials lift from here, they remove a weight from the ASX 200 and can clear the path for an index break above 8,600.
Materials: New All-Time Highs — “Highs Beget Highs”
Materials have broken to new all-time highs after a six-week compression into the rising MAs. That breakout extends the rally off the 50-day and confirms leadership from the big miners (with new Motion Trader signals across large and mid/small names this week).
All-time highs often lead to more all-time highs. With materials strong and financials potentially turning, the backdrop for the ASX 200 improves.
- Learn the logic behind breakouts:
ASX Breakout Strategy → https://www.motiontrader.com.au/resources/investment-insights/asx-breakout-strategy/ - Finding leaders within uptrends:
How to Find ASX Stocks in a Strong Uptrend → https://www.motiontrader.com.au/resources/investment-insights/how-to-find-asx-stocks-in-a-strong-uptrend/
Equal-Weight ASX 200: Broad Participation, Not Just Miners
The equal-weight ASX 200 remains above its rising MAs with a strong November advance followed by a shallow pullback. That’s textbook buy-the-dip behaviour and shows the market isn’t being propped up by a handful of heavyweights. It points to broader participation and a still-healthy trend structure.
Bottom line (ASX): I’m continuing to treat this as a pullback within an uptrend, with odds favouring a rally back to and through the MAs rather than a breakdown to new lows. I’m staying long, adding on breakouts, and managing risk with wide trailing stops.
S&P 500: 5.7% Pullback to the 100-Day, Then a Strong Rebound
The S&P 500 has completed a ~5.7% pullback from all-time highs to the 100-day moving average, followed by a sharp rally. Since the GFC low in 2009, this is roughly the 31st 5%+ pullback — and 20 of those were in the 5–10% range that often fades into the longer-term uptrend.
Today, price sits above the 50- and 100-day MAs, consistent with an ongoing bullish trend.
Equal-Weight S&P 500 & Breadth: False Breaks and Follow-Through
A few weeks ago the equal-weight S&P 500 broke below a two-month range — but there was no follow-through. That false breakdown reversed quickly, a typical sign that buyers remain dominant.
Breadth has also improved, aligning with the rebound. Put together, this supports the view that recent weakness was a pullback, not a regime shift.
A plausible path: some sideways “backing and filling” into late December, then a seasonal breakout if breadth continues to firm.
Transports: Quiet Leader, Bullish Signal
The US transports have broken out of a range and are hovering near all-time highs. Transports strength often speaks to underlying economic activity — a useful cross-check when the narrative fixates on whether an AI “bubble” is forming. Leadership outside megacap tech supports the case for a broadening advance.
The Unusual Backdrop: Gloomy Sentiment at Market Highs
The University of Michigan Consumer Sentiment Index remains bombed out near historic lows, a backdrop usually associated with recessions and weak markets. Yet equity indices are near highs. The survey isn’t a timing tool, but cycles in sentiment tend to oscillate from lows to highs over time. Rising sentiment later would likely act as a tailwind.
Takeaway: gloomy sentiment is typically a rear-view mirror indicator — not a reliable predictor of trouble ahead.
👉 For a deeper dive into technical analysis, check out our Weekly Strategy Sessions.
Motion Trader‘s algorithms scan more than 2,000 ASX stocks daily in search of medium term investment trends. We then tell our members precisely when to buy shares. And most importantly, we tell them when to sell.
Try a no obligation FREE 14-day trial of Motion Trader, and see what an algorithmic trading approach could do for you.
Take a Free 2 week Motion Trader trial
Q: If the ASX 200 is below declining MAs, why aren’t you bearish?
Because price is holding gains under resistance, financials show seller exhaustion, and materials just made new highs. Structure points to consolidation, not a trend break.
Q: What would turn the ASX 200 setup bearish?
A series of lower highs beneath 8,600, weak financials rallies that fail at the MAs, and a decisive break of the November low.
Q: Does the S&P 500 rebound mean new highs immediately?
Not necessarily. A sideways phase is possible first, but with price above the 50/100-day and breadth improving, odds favour higher.
Q: Why watch transports and equal-weight indices?
They filter index concentration risk. Strength there signals broad participation and a healthier advance.
Q: How do you manage risk during uncertain periods?
Follow a rules-based plan: buy breakouts, hold uptrends, and use wide trailing stops to exit when trends end.
Meet Jason

I'm Jason McIntosh, the creator of Motion Trader. My career began in 1991 on the trading floor at Bankers Trust. Nowadays, I trade my own systems from home in Sydney.
Motion Trader is for investors who value robust analysis, data driven entry and exit signals, commentary, and education. I use engineered algorithms to identify when to buy and sell ASX stocks. No biases or guesswork, just data driven signals.