Time to Buy ASX Shares? | Episode 74
By Jason McIntosh | Published 7 October 2022
Where is the Stock Market Going?
00:00 Intro
00:29 ASX 200 repeals a “bear raid” (what next)
02:07 What a double bottom means for ASX shares
03:48 Key features of the current set-up
04:54 Where I’ve been adding exposure (and why)
07:06 Did gold just make a key low?
08:36 You’ll never guess this top performing asset
09:30 Two gold stocks to watch closely
Transcript
Please note: Charts available from video
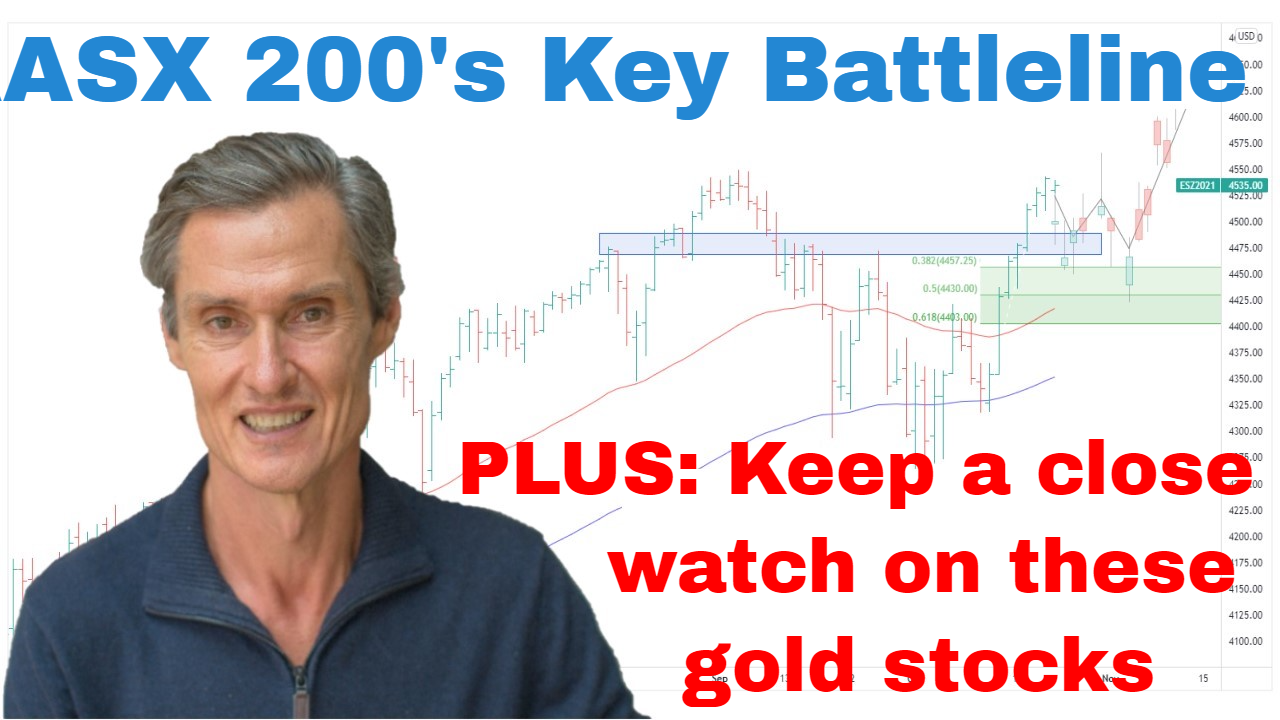
This has been a significant week for the ASX 200. It’s gone from a position of vulnerability to now having a double bottom support at around 6400. So, let’s just jump over to the hourly chart and have a closer look at this price action. So, what we had during the week was the market tested below this 6400 level on several occasions but there was no follow-through selling. And as we saw on the S&P 500, if you saw that video earlier, what we saw there is when you get so many people positioned for the worst, in this case, it was getting being positioned for a selloff, the opposite often happens.
And this is very much what we’ve seen in the ASX 200. And the rally got a further kick during the week, during this point around here on the chart when the RBA decided to slow the increases of interest rates. And I think this just adds speculation about whether other central banks are going to follow suit, and maybe that could be a catalyst for further upside in global equities. Don’t know. That’s just conjecture as to whether that could happen, but it’s certainly one of those possibilities.
So, let’s just come back to the daily chart. And we spoke about the possibility of a double bottom last week. And what happens is these double bottoms, they sometimes mark key turning points in markets, and they form when a market comes back to retest a previous low but then doesn’t attract any further selling, and the market rebounds. And I’m going to show you an example of an earlier double bottom in the ASX 200. So, this is from 2010. So, let me just go to a weekly chart. I’m going to find our way back over to 2010. So, it’s just in here. This is another example of a double bottom. So, this happened after the GFC lows. We had the GFC low. We had a strong rally. Market rallied into the beginning of the year, so it’s January 2010, and then it went…And remember, this is on a weekly chart, so it does compress the scale a bit. From the January high, for the next six months, the market corrected lower. We had a low in May, we had a rally, then the market came back down, retested, couldn’t get follow-through selling, and then the market continued on upwards and we had that double bottom.
And now there’s no guarantee that the same flow is going to happen this time around, but it’s just one of those examples of how this technical pattern can play out. So, with the ASX 200 with where it currently stands, let’s go back over to current day, with where we are now, I’d say the ASX 200 is really in a bit of a neutral zone. The strength of this rally off the low, it removes the immediate vulnerability that we had last week when we were sitting right on this support, and the potential was there for a swift move lower. So, it’s removed that vulnerability, but it’s still below the moving averages. So, we have the 50 and the 100-day moving averages. So, the market is still below those moving averages, and it’s just coming up to a resistance band around…I’m drawing some more resistance, somewhere around about here, around this 6900 mark. We’re approaching…yeah, we’re going to pick up some resistance through these points here. So, the market is just approaching that now, and that has the potential to cap this rally or at least slow this rally down.
And if you saw my video on the S&P 500, you’ll know that I’ve added some exposure to the market. So, just going over the S&P 500. I added some exposure this week to the S&P 500. If you’re interested, I was using an ETF with a ticker IHVV. So, it’s an iShares S&P 500 ETF, and its current currency hedged. That’s what the H in the IHVV stands for, hedged. And what my thinking is in using a hedged product to trade the S&P 500, just getting a small positioning at this point is that I think if equities do rally off this low, then we also may get a pullback in the U.S. dollar and a corresponding rally in the Australian dollar. And that’s why I’d want my exposure to the U.S. to be currency-hedged. And the reason I’ve gone for U.S. exposure is because I think the near-term upside in the U.S. market, I think there’s more near-term upside in the U.S. market than there is locally. So, the S&P 500, it’s approximately 27% off its highs, whereas you come back to the ASX 200 and we’re just about 13% from the highs. And I’ve already got exposure to the ASX generally or the all ordinaries through individual stocks. So, that’s why I’ve added some ETF exposure in the U.S.
And now I want to finish up with having a quick look at gold because that’s had some…it’s had a very interesting week. But first, if you’re getting some value from this, please hit that like button. Also, leave a short comment, just “Hey, thanks for the video.” It tells YouTube that people are watching, people engaging, then YouTube shows more people, which is a really important thing for someone like myself who’s making videos because you want them to be seen. And also, please hit that subscribe button, and come over and visit me at motiontrader.com.au and see the other things I’m doing which might be able to help with what you are doing.
So, okay, let’s jump over and have a look at gold. And as I said, it’s been an interesting week. So, just like the equity markets, gold broke down below a key support. So, this support had held for the last two-and-a-half years. So, gold broke below that support through the week, and again, like those equity markets, there wasn’t follow-through selling. And just to remind you, I want to remind you what can happen when a market does break support. So, I’m going back to gold. This is a gold chart from 2012 to 2013. Just like now, we had a key support level in gold. When that support went, the gold price absolutely got hammered. So, these supports are something to be aware of. They’re something to respect and something to take seriously.
As it turns out on this occasion, at least so far there wasn’t the follow-through selling, and were bounced back above that support zone. So, that price action is definitely an encouraging sign. It’s encouraging the gold. It didn’t sell off once it broke below that support. But even all that said, I think it’s still too early to call this as being a definitive low on gold. It’s encouraging, definitely encouraging. It removes that immediate vulnerability that we had when the price was just sitting here, but I don’t think it’s all clear to just start loading up on gold at this point.
And it’s interesting to look at gold in Aussie dollar terms because we often talk about gold in U.S. dollars, but it’s also really interesting to look at it in local terms. And it probably surprised a lot of people that gold is actually one of the best-performing asset classes this year. So, from the start of the year, gold is one of the best. It’s up about 6% in Aussie dollar terms, and it’s only about 7% off its all-time high. So, while there’s been a lot of talk about gold falling, it depends what currency you’re talking about it in. And the way it looks in Aussie dollars is how it looks in a lot of other currencies around the world at the moment. Most of the focus is on the U.S. dollar-priced gold, and the strength in the U.S. dollar has been behind much of that decline.
So, just quickly, want to have a look at a couple of gold stocks. And so I thought we’d start by going and having a look at Northstar. And so Northstar is one of the big locally listed stocks. What’s interesting here is it’s just broken up out of a bullish pennant formation. So, we’ve had at the initial rally, consolidation, and just in the last week, it’s broken out of that pattern. So, that’s encouraging. It’s also now above its moving averages. The moving averages haven’t crossed yet, so it could still be early. It’s probably a little bit too early for me. I’ll wait for the 50 to 100-day moving averages to cross, see if there’s some consolidation. It could still be several months away for me if it does continue to trade positively. But it is an interesting one to watch.
Also, another interesting one is Newcrest. So, on this, I’m just going to quickly jump to a weekly chart just to show you this longer-term support that it came back to. So, it’s been tested multiple times or many times over the last, what is that, the last 16 or so years, so quite a longer-term support level, and now it’s just bouncing off that support again. So, just coming back to the daily chart. It’s coming off a very oversold level, so just the rebound potential is quite reasonable. There could be some short-term trading opportunities here.
For me, it’s a bit early. The moving average is still below the moving averages, the 50 and 100-day. There’s still a fair way of crossing. So, I’d rather wait and see and approach this from a more medium-term perspective. But there is some signs of encouraging price action in the gold space. So, it’s been a turbulent, and it’s been a fascinating and interesting week. A lot of really interesting things happening in that price action at the moment, so let’s see how this week fares in the ASX 200. And also keep watching that gold space and see whether it can hold above this support now it’s back above there.
Please see video for more details analysis and charts
Looking for the best ASX stocks to buy now?
Motion Trader‘s algorithms scan more than 2,000 ASX stocks daily in search of medium term investment trends. We then tell our members precisely when to buy shares. And most importantly, we tell them when to sell.
Try a no obligation FREE 14-day trial of Motion Trader, and see what an algorithmic trading approach could do for you.
Meet Jason

I'm Jason McIntosh, the creator of Motion Trader. My career began in 1991 on the trading floor at Bankers Trust. Nowadays, I trade my own systems from home in Sydney.
Motion Trader is for investors who value robust analysis, data driven entry and exit signals, commentary, and education. I use engineered algorithms to identify when to buy and sell ASX stocks. No biases or guesswork, just data driven signals.