SP500 Rally Could Surprise Investors | Episode 57
By Jason McIntosh | Published 5 August 2022
Trade the Trend is a weekly video focusing on where the stock market is going. It’s for investors and traders looking for insights to the market’s next move. Jason uses technical analysis of stocks and trend following techniques to help you piece together the world’s biggest puzzle.
Where is the Stock Market Going?
00:00 Intro
00:35 Why contrarian investing is so hard (plus a classic example)
02:38 What the SP500’s latest price action means (can the rally continue?)
05:35 Key an eye on these key SP500 resistance points
08:59 Is the SP500 in a bear market rally? (Plus three scenarios to watch for)
Transcript (abridged)
Please note: Charts available from video
In this video, I’ll be focusing on the S&P 500. I’ll discuss the ASX 200 in a separate video. And in this video, I’m going to be focusing on addressing the question about whether this is a bear market rally. I’ve also got some fascinating graphs for you, so make sure you stick around for those.
So, what we’ve got on the chart on the screen here is the S&P 500. I thought we’d start by looking at the current setup because it’s amazing.
It’s just amazing how quickly sentiment can change to where we were a couple of weeks ago. If you might remember, if you’ve been watching these videos, a couple of weeks back I was showing you some charts that showed there were record flows into inverse ETFs and there’s also a massive amount of buying of options that were betting on a crash.
But the price action that was seen through late June, early July was telling us a different story. It was becoming resistant to the bad news and couldn’t sell off, couldn’t sustain selloffs on bad news. And then we had the situation where the S&P 500 started to break upwards. It broke out of this bullish chart formation on the daily chart.
So, it’s often the case when so many people are expecting the market to do one thing, but it does something else entirely. And it’s really interesting because there’s always so much talk around contrarian thinking. But it’s just one of those things that’s so much easier said than done because it’s just so easy to get caught up in the extreme sentiment of the time, be it both bullish at market highs and also bearish at market lows.
And I think what we saw through here, through June, and into early July, was a classic case of the market giving clues that it was at least temporarily exhausted on the downside. But I think the fear that so many people had that there was going to be a crash, it kept them fixated on the downside. So, hopefully, these videos are helping you see possibilities that many other people aren’t considering.
So, let’s jump over to the four-hourly chart and get a little bit more detail on the recent price action. And so here’s our four-hourly chart of the S&P 500. And I think what we’ve been seeing over the last couple of weeks is the most encouraging price action since the January high.
So, what I like about the price action over the last couple of weeks is that the dips are all being bought, and then the market is then pushing higher. And you can also see this series of higher highs and higher lows as this momentum has continued to build. And this is also what we describe as an impulsive move.
So, this move over the last couple of weeks, you describe that as impulsive. And by that, it means that the up legs are strong and there’s not a whole lot of overlapping price action, and then the consolidations largely move sideways and they’re being fairly shallow. So, that’s where the dips are being bought.
And you can see the market’s coming back to this moving average and then rallying. So that’s impulsive price action. And I think that price action is likely then to attract fresh money flows off the sidelines, which in turn can fuel further gains. So, I think the S&P 500 really seems to have broken that sell cycle. We can look back. This sell cycle that had been in place for several months, I think this latest price action does break that. And it does break that sell cycle I think at least temporarily.
So, let’s jump back to the daily chart. And what I like on this daily chart is that the S&P 500 is now above both its 50-day and 100-day moving average. We’ve had a week of closes above the 100-day moving averages. So, I think that’s a real positive. Moving averages are yet to turn high. They’re starting to round upwards but they’re yet to cross over.
That’s what I like to look for as a telltale sign that a more sustained advance is underway. So, it’s not there yet, but it’s looking encouraging. I think simply being above those moving averages is positive, and I think it removes the vulnerability that’s always present when a market is below the moving averages.
And this is something I’m always telling the members of my Motion Trader service, and it’s that all the bad stuff, well, at least most of the bad stuff tends to happen when the market is below those moving averages. So, that’s when it’s most vulnerable. So, having the market now above the moving averages, I think that is definitely a positive.
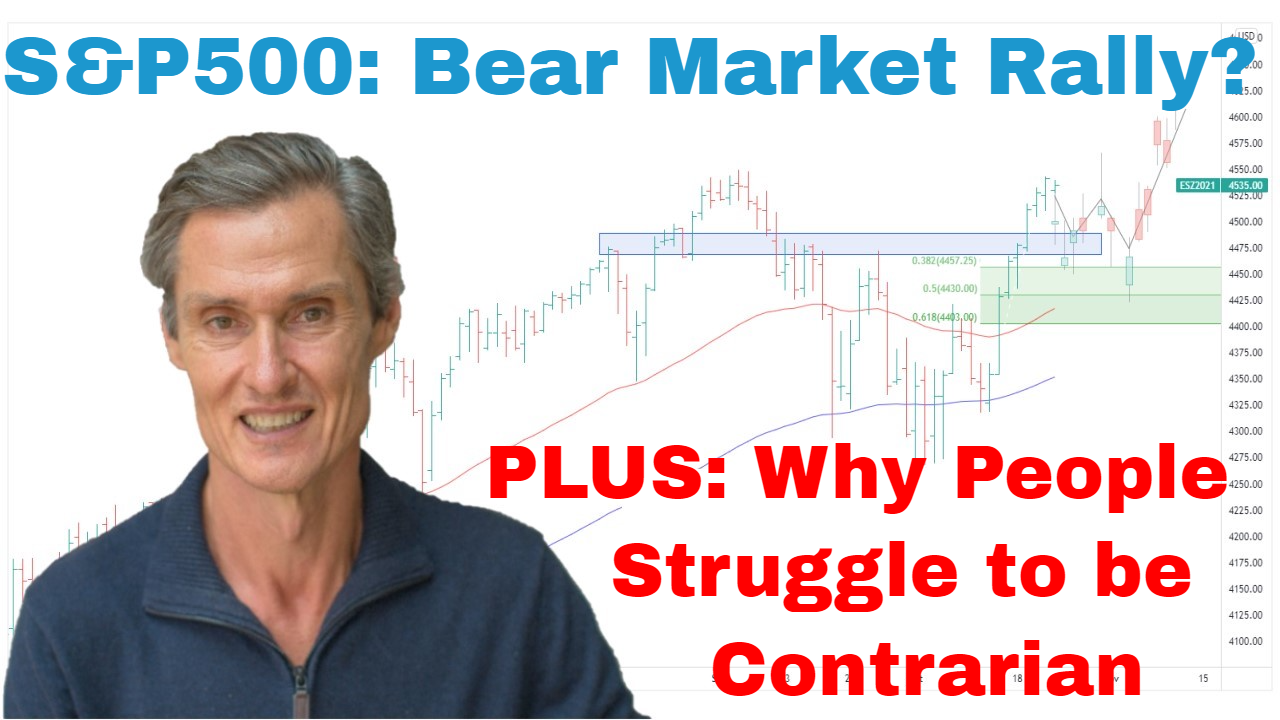
And just looking at this chart… So, we can add some resistance in, which is interesting to have a look at to give us a gauge of where we might be heading next. So, just lining it up. I’d say there’s probably some resistance between around 4,300, and, let’s say, 4,200. It picks up this band through here. It’s not perfect because these points fall below it.
But what I’m trying to do is I’m trying to identify a technically active area that could cause this rally to pause. I think this pretty much does it because it picks up some highs here, picks up some lows, this overshoots, picks up this area, picks up a high here from back in June. So, I think that’s a fairly solid overhead resistance band.
And we can also add some Fibonacci retracements onto this chart as well. So, I think this June low, I think this is really going to be a significant low point. So, what I’m going to do with the Fibonaccis, I’m going to use the January high and I’m going to use that June low. And when we do that, you can see that the 50% retracement is right here around this resistance span that we’ve identified between 4,300 and 4,200.
So, I think it adds to the significance of that resistance point in there around 4,200, 4,300, I think that’s a real area to keep an eye on over the next few weeks. And if you’ve been watching my videos over the last couple of weeks, you’ll know that I’ve been talking about incrementally getting back into the market.
I still think that’s the play, but with the S&P 500 really now starting to close in on both the 50% Fib retracement and a resistance zone. I’m looking at this now and I’m thinking, “I’d probably hold off adding much exposure here.” There doesn’t seem to be a lot of asymmetry in adding exposure so close to a resistance area. I think that’s a natural place here for the S&P 500 maybe to pause, maybe catch its breath.
And if that happens, we can then assess the price action for clues as to how the market may move from there. And so now I think the big question now is, is this rally bear market rally? And the truth of the matter is that nobody knows. I’m seeing so many people out there at the moment talking with high conviction on the subject.
Some are saying, “This is definitely a bear market rally.” Others are saying, “No, no, we’re going off to new highs,” and they’re talking with such conviction. But thing is, we’re only going to know the answer with the fullness of time. But what I want to do with this video is really to look at some of the scenarios. So, while I can’t tell you what will happen, I can help you be better prepared for what could happen.
And I think that’s the difference between successful investors and successful traders and those who really don’t make the grade because the successful ones, they’re prepared for possibilities. They’re not acting as if they know what is going to happen because nobody knows. So, let’s start with the positive. I think on the positive side, there is a case to be made that the bear market is over.
There really seems to be this consensus view at the moment that this is indeed a bear market rally. Much of the commentary I’m seeing is talking about bear market rally. And when something is consensus, my contrarian side starts to get pretty interested. And I want to show you something on Google. I’m going to show you something called Google Trends.
So, what you can do with Google Trends is you can type in a search term. So, I’ve typed in bear market rally, and it shows you the interest in searching for that term. And here we are here. There is high interest in searching for bear market rally. This is over the last 12 months. The last peak was towards the end of March where we had started to get a rally. We got…I think it was a 12% rally in late March.
And now we’re seeing even more interest in searching up bear market rally. So, it shows a lot of people with this idea that there’s more to come, that this isn’t the real thing. So, one scenario, going back to the S&P 500, one scenario…I’m just going to make a little bit more room here. Let’s take off a…take that off. And so let’s say one scenario would be that the market…I’ll draw something.
And this, of course, isn’t the course the market will take, but just for the sake of looking how could the market get back to a new all-time high? Maybe it does pause around this point for a few weeks, could break higher, a little bit more consolidation, and then make its way up to a new high. It’s feasible that that could happen over perhaps the next six to nine months. And then you’ve got all those people thinking this is a bear market rally watching on from the sidelines as stocks rally without them.
And so this isn’t my preferred scenario, but it’s why I think it’s worth easing back into the market because I think it’s definitely possible that that could happen. That’s like a V-shaped recovery scenario. And we do know V-shaped recoveries do happen. They don’t happen every time, but they can happen, and that would be how one could play out.
There’s another possibility that I want to show you, and it’s over here. So, just have a look at this one. This is from a previous period, and here’s an example of a zigzag or a sideways type scenario. So, in this case, we’ve had the selloff, which we’ve experienced over the last few months. There’s then been a rally, and the rally could last for several months that we’re going through at the moment. It may not end any time soon if it were to end.
But then from there, we could get a situation where the market gets up, maybe gets towards a new all-time high. Then maybe it starts to lose momentum and starts to fall away and retest the low. So, that would be your zigzag or your sideways type correction. And that’s certainly one of the possibilities. And maybe if that were to play out, maybe it would be retesting the lows, another bout of weakness maybe later in the year.
If I had to pick a scenario, this would probably be the one I’d most favor. And this is why I don’t want to aggressively charge back into the market at this point. Of course, we want to make money, but we also need to manage risk. And I think there’s still a very real risk that this isn’t over. That’s why I’m an advocate of incrementally increasing exposure to the market rather than just wham bam and get everything back in there.
The third scenario I’ll discuss is…I think this one is less likely but nonetheless, it’s one I think it’s really important to be aware of because it is possible. So, this is the S&P 500 from a past time. History never repeats exactly, but you do see the same influences and the same type of setups and similarities merge. It’s just a case of which one is it going to be.
And so if we look at this one here, this is quite similar to what we’ve seen so far. So, from a high, we had a six-month selloff that fell about 30%, started to get a strong rally like we’re seeing now, an impulsive move, got above those moving averages, closes above the moving averages. Put on a Fibonacci retracement like you saw me just do with the S&P 500. The market started getting up towards the 50%, started getting up near this resistance band.
I’m sure a lot of people would have been thinking, “Well, this is looking positive. Maybe we’re off to new highs,” but the market doesn’t always do what you think it might do. We look at what happened next. The market starts to stall, roll over. Maybe it’s going to kick back up again. People are still optimistic, but then the trap door opens and it’s a significant fall.
So, again, I say, it’s not my preferred scenario, but it’s important to understand what’s possible. And when we know what’s possible, we can use strategies to manage the risk. And that’s what I do myself, and it’s how I help others do that through my Motion Trader service. So, for now, I think it’s a case of cautiously giving that upward momentum the benefit of the doubt. It’s a case of easing into positions and keeping a close eye on the charts, close eye on that price action because these markets may not be out of the woods yet.
Please see video for more details analysis and charts
Looking for the best ASX stocks to buy now?
Motion Trader‘s algorithms scan more than 2,000 ASX stocks daily in search of medium term investment trends. We then tell our members precisely when to buy shares. And most importantly, we tell them when to sell.
Try a no obligation FREE 14-day trial of Motion Trader, and see what an algorithmic trading approach could do for you.
Meet Jason

I'm Jason McIntosh, the creator of Motion Trader. My career began in 1991 on the trading floor at Bankers Trust. Nowadays, I trade my own systems from home in Sydney.
Motion Trader is for investors who value robust analysis, data driven entry and exit signals, commentary, and education. I use engineered algorithms to identify when to buy and sell ASX stocks. No biases or guesswork, just data driven signals.