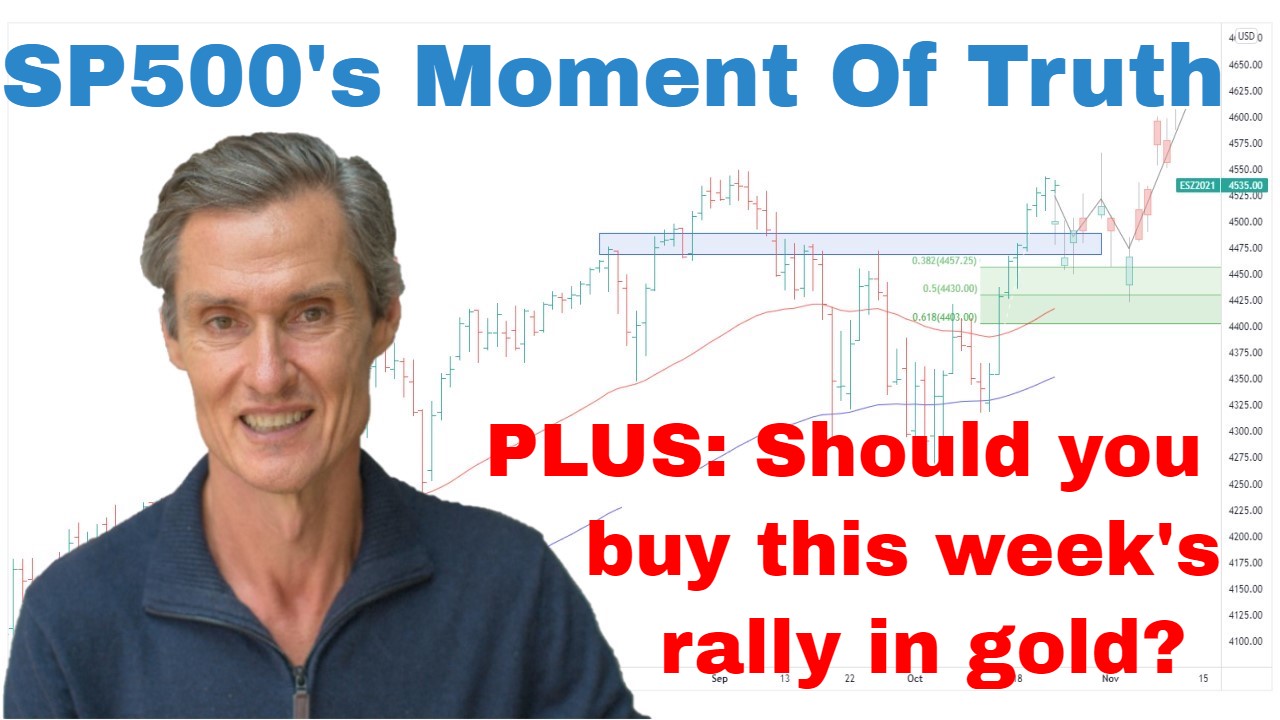
SP500 Moment Of Truth | Episode 122
Where is the Stock Market Heading?
00:00 Intro
00:30 SP500 on the verge of a big development (this is how to play it)
04:33 Don’t overlook this. It’s important.
05:42 The best stock market rallies occur when this happens
08:32 What this reversal means for the ASX 200
10:36 Should you buy this week’s rally in gold?
Transcript
Please note: Charts available from video
This video is going to focus on the S&P 500 and the U.S. markets generally. I’m also going to have a look at the ASX 200 and gold, so make sure you stick around for that. As always, this is general commentary and doesn’t take your personal situation into account. And just one video this week due to Easter. Back with the usual format in a couple of weeks’ time.
So, let’s start off with the S&P 500. And it’s been a pretty constructive week overall in that we’ve seen the market continue to rally off this support, big support level around 3800. We’ve seen a continued rallying up towards the top of this downward-sloping trading range, which you’ve seen me talk about over the last couple of weeks. And what’s been interesting is this week, we’ve got to the top of the range and we’ve started to pull back.
And it’s also interesting and encouraging that the price is currently comfortably above these moving averages. So, I’m looking at the 50 and the 100-day moving average. So, I’ll come back to this daily chart in a moment. But first, let’s just quickly go over and have a look at the hourly chart and just see how this has been unfolding. So, this is looking at the price action from the middle of March. And it was interesting from the middle of March to the end of March, it was quite volatile price action.
We’d see strong rallies, and then swift and sharp declines. But over the last couple of weeks, we’ve really seen the upward trends start to become smoother, more consistent. And what we can say from that is that at least in the near term, the bulls seem to have won the most recent round. It was very much a two-way battle. A lot of people looking for the market to collapse in early March and a big sell-off, but that didn’t happen.
And often what people are looking for, what a lot of people think is the most likely scenario, it often doesn’t play out. And we’ve got what I think many would say has been a fairly unlikely rally. And it’s also interesting just to see how this chart pattern I spoke about last week has played out. We’ve got this head and shoulders formation. So, you even got the left shoulder.
And we’ve got the head, and then the right shoulder. And this week, we’ve got the breakout, and we’ve continued to move higher. Just a short-term chart pattern. It can appear on hour charts, daily charts, monthly charts. It’s more the sentiment that forms during this right shoulder, which is really interesting to note where the market gets really bearish and expects a new low is in the makings. Then it can’t follow through with the selling and we get the reversal.
And that’s what we’ve seen. So, let’s just get back to that daily chart. And I’m not going to preempt a breakout from this range. Preempting breakouts often ends badly. People end up buying just below resistance, and then getting stuck as the market pulls back. So, I prefer to wait for a breakout rather than preempt one. But having said that, it’s looking more and more like this market wants to test higher.
And it does seem at this stage like we will get a breakout from that range. Also, keep an eye on resistance, which is just above the market at around 4200. So, let’s just draw that in here. So, we’ve got this structural overhead resistance just above the downward trend line. So, there’s a bit of work for the market to get higher, but if we do get above there, well, then it really does start to add to the case that this is a large basing pattern.
And we do get the potential for the market then to continue back up towards 4400, 4500, and then we just continue to see how the price action unfolds rather than making big predictions now about bull markets. It’s a case of following this price action rather than predicting what it’s going to do. And that’s been the case for the last several months. Going over and having a look at the S&P 500 equal-weight.
And this has been an encouraging week in that we’ve got quite a strong rebound from the lows. That’s what we wanted to see. I think that the key now is, does this market hold onto these gains? Does it travel sideways for maybe a week or two and then start to turn higher again? The problem I’ve got with this is we are really right in the middle of this range. So, you can’t say you’ve got a great deal of momentum when you’re in the middle of a range.
And this is the potential caution or the sticking point with the S&P 500, which looks like it’s on the verge of breaking higher. The equal-weight S&P 500 is not breaking higher at all. And as I’ve said in the last couple of weeks, it suggests that the biggest stocks are doing most of the work. And historically, you get the best rallies when you got the overall market running, not just the upper end of the market. We want broad participation.
And on that note, I’m also keeping a close eye on the Russell 2000, which is looking at the small caps. And just like I was saying with the equal-weight, the best rallies for the stock market overall tends to occur when the stocks in the Russell 2000 are participating, and this index is participating. But that’s certainly not the case at the moment. Right now, we see the Russell is down here at the lower end of this trading range, which has been in since June.
So, what’s that? Around eight, nine months now. We’re down here at the bottom end of the range. And we’ve also got a situation where the market is trading below these moving averages, which are trending lower, the 100 and the 50-day moving averages. So, it is set up towards the vulnerable side where you have a market below the moving averages and the lower end of the range. It’s not a sign of overall strength.
So, this is why I think there’s a good case for remaining cautious towards the U.S. market despite the fact that the NASDAQ 100 and the S&P 500 are both looking constructive. And as you’ve heard me say over and over for months now, I think the play here is being cautiously long. And that’s been the case since back around October, where we had this big reversal day where the market broke down.
I think it was a CPI number. And we closed higher, didn’t get the follow-through selling. From that day or that week, I’ve pretty much been saying, “Let’s give this long side the benefit. Let’s see where the momentum goes.” I think that’s the case, but as it’s been since then, it’s been caution. It’s not been a case of having big bets.
And for me, it’s a case of keeping stocks that are in my portfolio that are working stocks which are in upward trends, and exiting those which are faltering, those which are selling off, which are breaking lower, which are hitting exit stops. It’s selling them. It’s not holding and hoping for recoveries. It’s being very disciplined with what you keep and what you get rid of.
And also holding some extra cash. I think now is also… Well, that’s what I’m doing with my portfolio. I have a higher portion of cash than I would if the market was in a strong upward phase. Now, if you’re getting some value from this, please hit that like button. Please leave a short comment, just, “Hey, thanks for the video.” It just tells YouTube people are watching. Then they do their magic and show other people, and that helps me a lot. So, please do that. Also, hit that subscribe button if you haven’t already done so.
Now I’m going to go and have a look at gold in a moment. But before we get there, just a quick look at the ASX 200. Positive week. We’ve got a V-shape price pattern over the last…that must be the last three or four weeks, and really strong rally off the lows. So, overall, I think the rally we’ve had off support at around 6800, 6900, the strength of that rally, I think that really negates the near-term risk that we had only towards the end of March, the near-term risk that the market was about to have another sell-off and head down towards this September low.
The strength of this rally, I think it takes that near-term risk off the table. It’s constructive price action. It looks like the market may need to do some work, may need to pause after that. Just in the last couple of weeks, this is nearly a 6% rally. So, it’d be normal for the market to have some pause. What we’d ideally see is that the pause is corrective, and it’s overlapping. It doesn’t really go too far, and then that sets the stage potentially for another push higher. But we need to wait and see.
We don’t know what price action we’ll get, but we really want to see any pullback being bought. We want to see the dip being bought. We want to see overlap constructive price action, and then we look for the possibility of another push higher. Quite similar to what we’re looking for on the S&P 500. And so let’s continue to watch. Let’s watch this price action over the next couple of weeks.
And like I said, though, with the S&P 500, I think the play is cautiously long. I’m interested in stocks that are breaking higher. I’m not interested in buying stocks which are falling. I want to buy into strength. I want to buy with momentum, and then use risk management to get rid of stocks if they’re not working. Now, we’ll just finish up with a quick look at gold. Another strong week in gold.
I thought we might have been setting up for a pause. Last week I was saying, “We’re stretched above the moving averages. We’re getting up towards resistance. I think maybe this is getting close to a pause,” but instead we’ve had another strong week. I’m going to continue saying what I said last week in that I like gold overall. I like the medium and longer-term structure. I think gold can go considerably higher over the medium to longer term.
But from a near-term perspective, I’m looking at this big overhead resistance region, double-top resistance at around just above 2000. We’re so close to that now. We’re even more stretched above the moving averages than last week. It just doesn’t look like an asymmetric point to be adding physical gold exposure right here and now. Just reminding you of what I’ve spoken about in the past.
This is just a previous period from 2019 where the market had a big run, got up close to a big overhead resistance. Again, it was stretched above those moving averages, and it remained stretched for a bit for several weeks, continued to get closer, but then the pullback happened. These things never play out the same way. It’s just an example of how markets get stretched above averages and approach resistance points.
I struggle to believe this has got the energy to really punch above such a strong overhead resistance when it’s already so stretched above averages. Something really has to go haywire in the global economy I think for that to happen. Could happen, but I think the odds do not favor that. Individual gold stocks can be another matter. Look at them on a case-by-case basis. But, yeah, it just doesn’t seem like that asymmetric setup that we like when we are making investments at the moment in gold.
So, let’s leave it there for the special Easter edition. I think you’ve got other things to do than look at videos in the stock market this weekend. So, thank you for joining me. I look forward to coming back and talking to you next week. Until then, bye for now.
Please see video for more detailed analysis and charts
Looking for the best ASX stocks to buy now?
Motion Trader‘s algorithms scan more than 2,000 ASX stocks daily in search of medium term investment trends. We then tell our members precisely when to buy shares. And most importantly, we tell them when to sell.
Try a no obligation FREE 14-day trial of Motion Trader, and see what an algorithmic trading approach could do for you.
Meet Jason

I'm Jason McIntosh, the creator of Motion Trader. My career began in 1991 on the trading floor at Bankers Trust. Nowadays, I trade my own systems from home in Sydney.
Motion Trader is for investors who value robust analysis, data driven entry and exit signals, commentary, and education. I use engineered algorithms to identify when to buy and sell ASX stocks. No biases or guesswork, just data driven signals.