SP500 Blindside Coming | Episode 102
Where is the Stock Market Heading?
00:00 Intro
00:34 SP500 has 2 competing technical patterns (I think this one wins)
03:20 This is how I’m positioned in SP500
04:00 You won’t believe what was said in last week’s comments section
06:34 No one is talking about this chart (but it says a lot)
09:35 This graph is extraordinary (you need to see it for yourself)
Transcript
Please note: Charts available from video
This video is going to focus on the S&P 500. I’ll cover the ASX 200, gold, and uranium in a separate video, and I’ll leave a link for that in the description section below. I’ve also got a fascinating graph for you. Gives I think a big clue as to where the markets might be going next, so make sure you stick around for that. As always, this is general commentary and doesn’t take your personal situation into account. With all of that said, let’s get into our first chart.
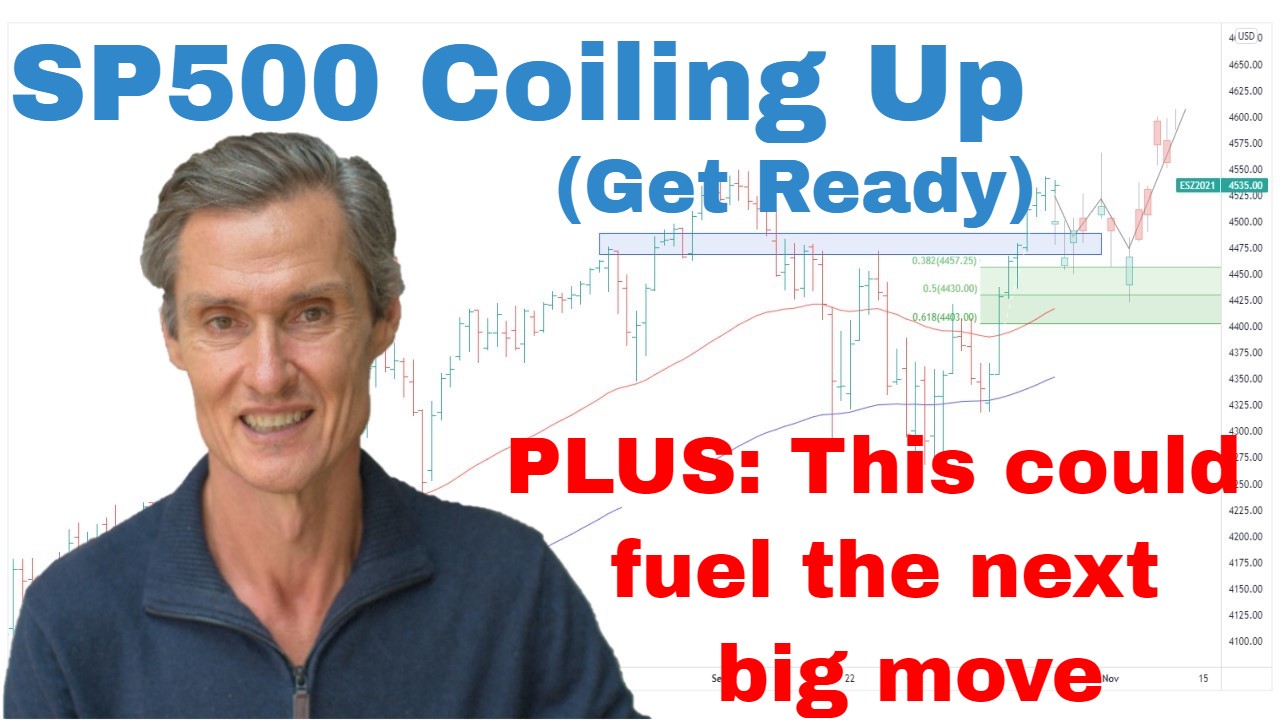
Okay, so we’re starting with the S&P 500. And this really is a fascinating chart that’s developed over the last 12 months. We’ve now got two competing patterns in play. So, the first one is a bearish pattern. We’ve got this downward trend line that’s been in place for over a year now which is well-watched, well-known, a lot of people following where this trend line goes and whether the market breaks. The other pattern is potentially bullish, and we’ve been talking about it a bit over the last few weeks. It’s this inverse head and shoulders pattern. So, this would be the left shoulder over here, in the middle we have the head, and just here we are potentially tracing out the right-hand shoulder at the moment.
And what would be interesting would be maybe over the next week, if the market tries to sell off again over the next few days perhaps and can’t get any follow-through selling, finds itself stalling at an attempt to sell off, then that could really set the stage for a break through this trend line maybe over the next couple of weeks. We never know the timing of these situations, but that remains… I think that is a very clear and present possibility that we look for over the next couple of weeks.
And it’s also really interesting in that when I look at this chart, it’s been interesting that over the last couple of months, the S&P 500, it’s really been quite range-bound. And when you look back over the past year, every time we’ve gotten up around these high points, well, the market hasn’t stayed there for very long. It reached a high in March and then a high again in August and very quickly fell away. What we’ve seen this time is the market getting to a peak in November, and it’s really just hanging. It’s just hanging around this region which is quite different than what’s happened previously.
So, I am open to this possibility that the market is producing some base through here, some launching platform to try and have another attempt at cracking above this trend line and kicking higher into the next couple of months.
As I’ve been telling you in the last few videos, for more than the last few videos, probably for the last few months, last couple of months, I’ve been long S&P 500 since the CPI spiked lower and reversal back upwards. I continue to hold that position. There’s no reason for me to exit at this point. I’m giving this upward momentum we’ve had from the October low the benefit of the doubt until the market gives me cause to think otherwise. And cause to think otherwise would be a breakdown. At this stage, I’d probably need to see the market breaking back down below 3700 with significant momentum to want to be reversing that position. But things can change. We need to watch how the price action develops.
And I’ll tell you one thing that has really fascinated me over the last week is last week in my video, you may remember me outlining this very same scenario that I think the market could be preparing for a kick higher. And what was so interesting is in the Comments section how adamant some of the people were that the market had to fall. And they told me all the reasons why. They told me that the Feds hiking. They told me that the liquidity conditions are tightening up. They told me that the earning season is going to be really bad. There’s going to be a recession, all these reasons why the market had to fall. And I’m seeing the same thing when other people post any potentially positive comment on YouTube or Twitter. The same type of comments come back.
Now I’ve got full respect for people with different ideas to me. I’ve got no problem with that. I’m not here to convert anyone to my way of thinking. I’m just sharing my perspective and the possibilities, and I see them, but when I see so many people outlining well-known facts, and I’ll look at that and I wonder if something else is possible. Is there another scenario that most people aren’t even aware of yet which could result in stocks rallying even only over the next couple of months? I’m just not sure the market is going to deliver an obvious outcome. And the obvious outcome for a lot of people is a sharp sell-off. I’m not sure it’s going to deliver that obvious outcome on a plate when it’s expected.
So, just to be crystal clear about all this, I’m not forecasting a new bull market. I’m not forecasting the market is heading up to new all-time highs. I’m just pointing out a possible pathway upwards over potentially the next couple of months, maybe it’s the first quarter, and we see how that develops. If it then starts to stall and roll over, well, then we strap in and we get ready for the bearish scenarios. But I think it’s important not to get boxed into one camp or another. Be guided by the price action, be guided by what we see developing on the charts, and keep an open mind because the price action can often hint at a future that hasn’t fully been thought of or fully occurred to most people. So, price action is so important to keep an eye on.
Now, what I want to do, I want to quickly jump over to the… We’ve looked at the S&P 500 index. I want to look over at the S&P 500 equal weight index. So, this is a really interesting chart to have a look at, and it’s interesting on a few aspects. So, firstly, unlike the S&P 500, the moving averages have actually crossed on the equal weight index. And we’ve also got the price is trading above the moving averages. And when I look at this chart, there’s this nice rounding… Actually, that’s the wrong pattern, wrong tool to use, this one here. When we look at the formation here, we’ve got this rounding, basing formation which is a reversal pattern. So, that’s particularly interesting to be aware of that.
Now it’s interesting that this is showing up in the equal-weighted index more so than it’s appearing in the index. Of course, when you look at equal weight it’s not dominated by the big heavy market cap leaders. It’s weighting those 500 stocks equally. So, to me, it suggests that there could be some really good opportunities amongst the mid to smaller end of the S&P 500.
And also when I look at this chart here, this doesn’t structurally look set up to accelerate to the downside. Things can change, but at this point in time, it looks more likely. This is a market which wants to try and go higher. There’s a resistance band to watch. Just drawing something now. There’s resistance. You can see this resistance band through here. It comes in at around 150 on the equal-weighted ETF. It’s an Invesco equal-weighted ETF. The resistance comes in at around 150.
What I’m going to be interested to watch over the next few weeks, does the market start to trade sideways and then ready itself for much higher? That’s a potential scenario which I’m watching. Potentially there’s another retest. Maybe it gets a bit deeper or maybe we retest this low from December and then try and rally it. But they’re the scenarios which I think are the most likely at this point. The price action change changes my probability of the possibilities changes as well, but that’s kind of how I’m seeing this market at the moment.
Now, if you’re getting some value from this, please hit that like button. Let YouTube know that you’re watching. It’s really important. Leave a comment. It tells people are engaging with the video. YouTube shows more people, and I make more video. And please hit that like button and subscribe button if you haven’t already done so.
And I just want to finish up with one last graph which is really interesting which I saw through the week. And this turned up in my Twitter feed. And what it’s doing it’s a Bank of America Merrill Lynch’s latest fund managers survey, and it shows how the big fund managers are weighting their portfolios in U.S. equities. And so let’s just enlarge this. And now this is really interesting. So, you can see at the moment it’s a significant underweight, significantly underweight in U.S. equities. It’s the largest underweight since back here in 2005. So, just going through these areas which are highlighted. This was the peak of the dot-com bubble. There was an exponential increase in the index and the managers overall became underweight. This was the bottom of the GFC, not the GFC, sorry, the dot-com bubble. It was the bottom of the dot-com bubble, and managers were underweight.
2005 was a different period. It was actually a flat market, rising interest rates, slowing growth, and an inverted yield curve. Sounds familiar, doesn’t it? And that was another period where managers were underweight. 2010 was a market correction. 2017 was a period where the market had risen by around 40% over 18 months, big players got underweight, and now we have where we are now. So, what this says to me is a lot of selling has actually been done over the last couple of months. A lot of negativity has been priced in.
What it also tells me is that it now requires quite a bit of buying just for these managers to come back to neutral. And this is another reason why I think the market could try and rally in the first quarter. But as I say, it’s still about being cautious, it’s focusing on areas of strength, and it’s about using risk management for any positions you take on board because there are negative scenarios which could play out, but don’t get boxed into a negative way of thinking. Of course, there are other things which could happen.
So, hopefully, that’s been interesting. Hopefully, that’s been helpful. Thanks for joining me. I look forward to coming back and talking to you next week. Until then, bye for now.
Please see video for more details analysis and charts
Looking for the best ASX stocks to buy now?
Motion Trader‘s algorithms scan more than 2,000 ASX stocks daily in search of medium term investment trends. We then tell our members precisely when to buy shares. And most importantly, we tell them when to sell.
Try a no obligation FREE 14-day trial of Motion Trader, and see what an algorithmic trading approach could do for you.
Meet Jason

I'm Jason McIntosh, the creator of Motion Trader. My career began in 1991 on the trading floor at Bankers Trust. Nowadays, I trade my own systems from home in Sydney.
Motion Trader is for investors who value robust analysis, data driven entry and exit signals, commentary, and education. I use engineered algorithms to identify when to buy and sell ASX stocks. No biases or guesswork, just data driven signals.